Data
83,911 items of data are available, covering 79,384 participants.
Defined-instances run from 2 to 3, labelled using Instancing
2.
Units of measurement are AU.
| Maximum | 0.665951 |
| Decile 9 | 0.567047 |
| Decile 8 | 0.552812 |
| Decile 7 | 0.542037 |
| Decile 6 | 0.53254 |
| Median | 0.523367 |
| Decile 4 | 0.51401 |
| Decile 3 | 0.503512 |
| Decile 2 | 0.491051 |
| Decile 1 | 0.47293 |
| Minimum | 0 |
|

|
- Mean = 0.521163
- Std.dev = 0.0377019
- 136 items below graph minimum of 0.378812
- 3 items above graph maximum of 0.661164
|
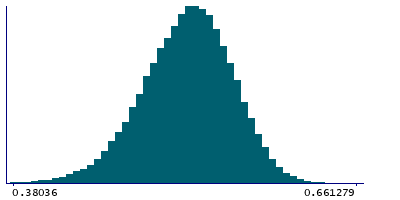
2 Instances
Instance 2 : Imaging visit (2014+)
79,153 participants, 79,153 items
| Maximum | 0.665951 |
| Decile 9 | 0.566768 |
| Decile 8 | 0.552521 |
| Decile 7 | 0.541726 |
| Decile 6 | 0.532199 |
| Median | 0.523048 |
| Decile 4 | 0.513688 |
| Decile 3 | 0.50317 |
| Decile 2 | 0.490699 |
| Decile 1 | 0.472483 |
| Minimum | 0 |
|
|
- Mean = 0.520838
- Std.dev = 0.0377474
- 124 items below graph minimum of 0.378198
- 3 items above graph maximum of 0.661053
|
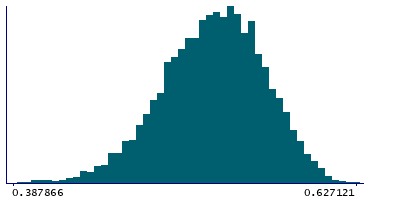
Instance 3 : First repeat imaging visit (2019+)
4,758 participants, 4,758 items
| Maximum | 0.627121 |
| Decile 9 | 0.571605 |
| Decile 8 | 0.557478 |
| Decile 7 | 0.547087 |
| Decile 6 | 0.538072 |
| Median | 0.529169 |
| Decile 4 | 0.519497 |
| Decile 3 | 0.508998 |
| Decile 2 | 0.497077 |
| Decile 1 | 0.479727 |
| Minimum | 0.265083 |
|
|
- Mean = 0.526569
- Std.dev = 0.0365139
- 9 items below graph minimum of 0.387849
|
Notes
Mean FA (fractional anisotropy) in fornix cres+stria terminalis (left) on FA skeleton (from dMRI data)
0 Related Data-Fields
There are no related data-fields
2 Applications
| Application ID | Title |
|---|
| 17689 | Genetic, environmental and lifestyle predictors of brain/cognitive-related outcomes. |
| 22783 | The joint analysis of imaging data and genetic data for early tumor detection, prevention, diagnosis and treatment |

