Data
83,911 items of data are available, covering 79,384 participants.
Defined-instances run from 2 to 3, labelled using Instancing
2.
Units of measurement are AU.
| Maximum | 0.673811 |
| Decile 9 | 0.558186 |
| Decile 8 | 0.541818 |
| Decile 7 | 0.529867 |
| Decile 6 | 0.519539 |
| Median | 0.509645 |
| Decile 4 | 0.499889 |
| Decile 3 | 0.489302 |
| Decile 2 | 0.476585 |
| Decile 1 | 0.458923 |
| Minimum | 0 |
|
|
- Mean = 0.508889
- Std.dev = 0.0393045
- 62 items below graph minimum of 0.35966
- 3 items above graph maximum of 0.65745
|
2 Instances
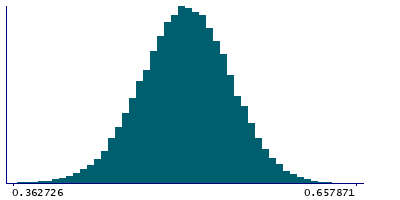
Instance 2 : Imaging visit (2014+)
79,153 participants, 79,153 items
| Maximum | 0.673811 |
| Decile 9 | 0.55815 |
| Decile 8 | 0.541735 |
| Decile 7 | 0.52978 |
| Decile 6 | 0.519489 |
| Median | 0.509551 |
| Decile 4 | 0.499798 |
| Decile 3 | 0.489163 |
| Decile 2 | 0.476356 |
| Decile 1 | 0.458677 |
| Minimum | 0 |
|

|
- Mean = 0.508781
- Std.dev = 0.0393858
- 59 items below graph minimum of 0.359204
- 2 items above graph maximum of 0.657622
|
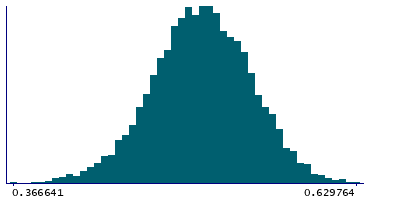
Instance 3 : First repeat imaging visit (2019+)
4,758 participants, 4,758 items
| Maximum | 0.629764 |
| Decile 9 | 0.558893 |
| Decile 8 | 0.542677 |
| Decile 7 | 0.53151 |
| Decile 6 | 0.520646 |
| Median | 0.511216 |
| Decile 4 | 0.501395 |
| Decile 3 | 0.49147 |
| Decile 2 | 0.479657 |
| Decile 1 | 0.462722 |
| Minimum | 0.256741 |
|
|
- Mean = 0.510681
- Std.dev = 0.037881
- 1 item below graph minimum of 0.36655
|
Notes
Mean FA (fractional anisotropy) in uncinate fasciculus (left) on FA skeleton (from dMRI data)
0 Related Data-Fields
There are no related data-fields
2 Applications
| Application ID | Title |
|---|
| 17689 | Genetic, environmental and lifestyle predictors of brain/cognitive-related outcomes. |
| 22783 | The joint analysis of imaging data and genetic data for early tumor detection, prevention, diagnosis and treatment |

