Data
83,911 items of data are available, covering 79,384 participants.
Defined-instances run from 2 to 3, labelled using Instancing
2.
Units of measurement are AU.
| Maximum | 0.003548 |
| Decile 9 | 0.002088 |
| Decile 8 | 0.001868 |
| Decile 7 | 0.001743 |
| Decile 6 | 0.00165 |
| Median | 0.001572 |
| Decile 4 | 0.001502 |
| Decile 3 | 0.001433 |
| Decile 2 | 0.001361 |
| Decile 1 | 0.001274 |
| Minimum | 0.000697 |
|
|
- Mean = 0.00163636
- Std.dev = 0.000335003
- 178 items above graph maximum of 0.002902
|
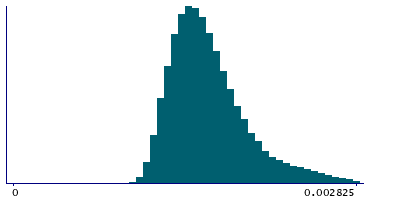
2 Instances
Instance 2 : Imaging visit (2014+)
79,153 participants, 79,153 items
| Maximum | 0.003548 |
| Decile 9 | 0.002093 |
| Decile 8 | 0.001871 |
| Decile 7 | 0.001746 |
| Decile 6 | 0.001652 |
| Median | 0.001574 |
| Decile 4 | 0.001504 |
| Decile 3 | 0.001435 |
| Decile 2 | 0.001362 |
| Decile 1 | 0.001276 |
| Minimum | 0.000697 |
|

|
- Mean = 0.00163856
- Std.dev = 0.000335698
- 160 items above graph maximum of 0.00291
|
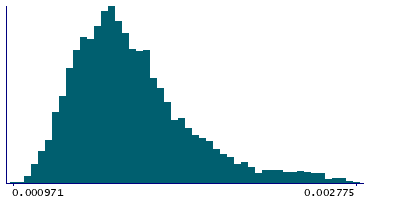
Instance 3 : First repeat imaging visit (2019+)
4,758 participants, 4,758 items
| Maximum | 0.003096 |
| Decile 9 | 0.0020165 |
| Decile 8 | 0.001813 |
| Decile 7 | 0.001694 |
| Decile 6 | 0.0016115 |
| Median | 0.001538 |
| Decile 4 | 0.001475 |
| Decile 3 | 0.001412 |
| Decile 2 | 0.00134 |
| Decile 1 | 0.001257 |
| Minimum | 0.000971 |
|
|
- Mean = 0.0015998
- Std.dev = 0.000321015
- 20 items above graph maximum of 0.002776
|
Notes
Mean MD (mean diffusivity) in fornix on FA (fractional anisotropy) skeleton (from dMRI data)
0 Related Data-Fields
There are no related data-fields
2 Applications
| Application ID | Title |
|---|
| 17689 | Genetic, environmental and lifestyle predictors of brain/cognitive-related outcomes. |
| 22783 | The joint analysis of imaging data and genetic data for early tumor detection, prevention, diagnosis and treatment |

