Data
83,911 items of data are available, covering 79,384 participants.
Defined-instances run from 2 to 3, labelled using Instancing
2.
Units of measurement are AU.
| Maximum | 0.002224 |
| Decile 9 | 0.000892 |
| Decile 8 | 0.000849 |
| Decile 7 | 0.000821 |
| Decile 6 | 0.000799 |
| Median | 0.00078 |
| Decile 4 | 0.000762 |
| Decile 3 | 0.000743 |
| Decile 2 | 0.000723 |
| Decile 1 | 0.000699 |
| Minimum | 0 |
|

|
- Mean = 0.000790096
- Std.dev = 8.04507e-05
- 4 items below graph minimum of 0.000506
- 394 items above graph maximum of 0.001085
|
2 Instances
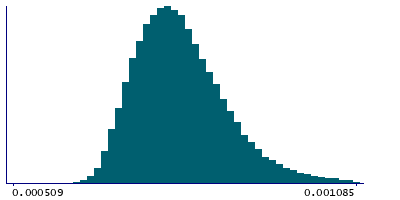
Instance 2 : Imaging visit (2014+)
79,153 participants, 79,153 items
| Maximum | 0.002224 |
| Decile 9 | 0.000892 |
| Decile 8 | 0.000849 |
| Decile 7 | 0.000821 |
| Decile 6 | 0.000799 |
| Median | 0.00078 |
| Decile 4 | 0.000762 |
| Decile 3 | 0.000743 |
| Decile 2 | 0.000723 |
| Decile 1 | 0.000699 |
| Minimum | 0 |
|
|
- Mean = 0.00079025
- Std.dev = 8.04559e-05
- 4 items below graph minimum of 0.000506
- 378 items above graph maximum of 0.001085
|
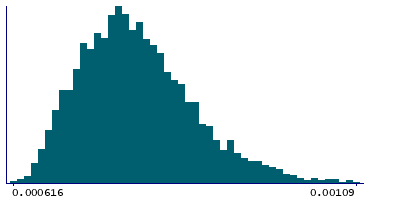
Instance 3 : First repeat imaging visit (2019+)
4,758 participants, 4,758 items
| Maximum | 0.001253 |
| Decile 9 | 0.000891 |
| Decile 8 | 0.000849 |
| Decile 7 | 0.00082 |
| Decile 6 | 0.000797 |
| Median | 0.000778 |
| Decile 4 | 0.00076 |
| Decile 3 | 0.00074 |
| Decile 2 | 0.000718 |
| Decile 1 | 0.000692 |
| Minimum | 0.000616 |
|
|
- Mean = 0.000787531
- Std.dev = 8.03202e-05
- 15 items above graph maximum of 0.00109
|
Notes
Mean MD (mean diffusivity) in corticospinal tract (right) on FA (fractional anisotropy) skeleton (from dMRI data)
0 Related Data-Fields
There are no related data-fields
2 Applications
| Application ID | Title |
|---|
| 17689 | Genetic, environmental and lifestyle predictors of brain/cognitive-related outcomes. |
| 22783 | The joint analysis of imaging data and genetic data for early tumor detection, prevention, diagnosis and treatment |

