Data
83,911 items of data are available, covering 79,384 participants.
Defined-instances run from 2 to 3, labelled using Instancing
2.
Units of measurement are AU.
| Maximum | 0.002414 |
| Decile 9 | 0.000907 |
| Decile 8 | 0.00087 |
| Decile 7 | 0.000851 |
| Decile 6 | 0.000836 |
| Median | 0.000824 |
| Decile 4 | 0.000813 |
| Decile 3 | 0.000802 |
| Decile 2 | 0.00079 |
| Decile 1 | 0.000774 |
| Minimum | 0.000468 |
|
|
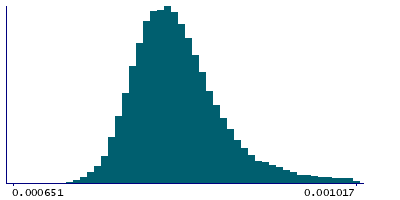
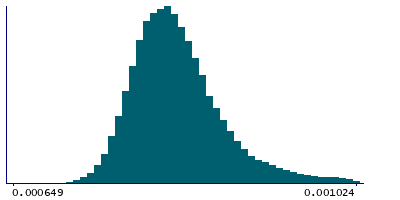
- Mean = 0.000836182
- Std.dev = 6.53477e-05
- 9 items below graph minimum of 0.000641
- 1452 items above graph maximum of 0.00104
|
2 Instances
Instance 2 : Imaging visit (2014+)
79,153 participants, 79,153 items
| Maximum | 0.002414 |
| Decile 9 | 0.000908 |
| Decile 8 | 0.000871 |
| Decile 7 | 0.000851 |
| Decile 6 | 0.000837 |
| Median | 0.000825 |
| Decile 4 | 0.000814 |
| Decile 3 | 0.000802 |
| Decile 2 | 0.00079 |
| Decile 1 | 0.000775 |
| Minimum | 0.000468 |
|
|
- Mean = 0.00083676
- Std.dev = 6.5707e-05
- 8 items below graph minimum of 0.000642
- 1395 items above graph maximum of 0.001041
|
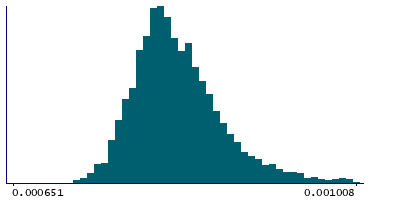
Instance 3 : First repeat imaging visit (2019+)
4,758 participants, 4,758 items
| Maximum | 0.001268 |
| Decile 9 | 0.000889 |
| Decile 8 | 0.000858 |
| Decile 7 | 0.000841 |
| Decile 6 | 0.000828 |
| Median | 0.000816 |
| Decile 4 | 0.000806 |
| Decile 3 | 0.000796 |
| Decile 2 | 0.000785 |
| Decile 1 | 0.00077 |
| Minimum | 0.000628 |
|
|
- Mean = 0.000826578
- Std.dev = 5.82163e-05
- 1 item below graph minimum of 0.000651
- 76 items above graph maximum of 0.001008
|
Notes
Mean MD (mean diffusivity) in posterior corona radiata (right) on FA (fractional anisotropy) skeleton (from dMRI data)
0 Related Data-Fields
There are no related data-fields
2 Applications
| Application ID | Title |
|---|
| 17689 | Genetic, environmental and lifestyle predictors of brain/cognitive-related outcomes. |
| 22783 | The joint analysis of imaging data and genetic data for early tumor detection, prevention, diagnosis and treatment |

