Data
83,911 items of data are available, covering 79,384 participants.
Defined-instances run from 2 to 3, labelled using Instancing
2.
Units of measurement are AU.
| Maximum | 0.001401 |
| Decile 9 | 0.000799 |
| Decile 8 | 0.000785 |
| Decile 7 | 0.000775 |
| Decile 6 | 0.000767 |
| Median | 0.00076 |
| Decile 4 | 0.000753 |
| Decile 3 | 0.000746 |
| Decile 2 | 0.000738 |
| Decile 1 | 0.000727 |
| Minimum | 0.000412 |
|

|
- Mean = 0.000761642
- Std.dev = 2.93436e-05
- 55 items below graph minimum of 0.000655
- 119 items above graph maximum of 0.000871
|
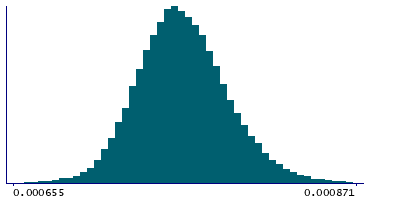
2 Instances
Instance 2 : Imaging visit (2014+)
79,153 participants, 79,153 items
| Maximum | 0.001401 |
| Decile 9 | 0.000799 |
| Decile 8 | 0.000785 |
| Decile 7 | 0.000775 |
| Decile 6 | 0.000767 |
| Median | 0.00076 |
| Decile 4 | 0.000753 |
| Decile 3 | 0.000746 |
| Decile 2 | 0.000738 |
| Decile 1 | 0.000727 |
| Minimum | 0.000412 |
|
|
- Mean = 0.00076166
- Std.dev = 2.9486e-05
- 53 items below graph minimum of 0.000655
- 116 items above graph maximum of 0.000871
|
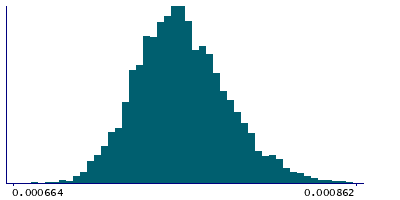
Instance 3 : First repeat imaging visit (2019+)
4,758 participants, 4,758 items
| Maximum | 0.000913 |
| Decile 9 | 0.000796 |
| Decile 8 | 0.000783 |
| Decile 7 | 0.000774 |
| Decile 6 | 0.000766 |
| Median | 0.00076 |
| Decile 4 | 0.000753 |
| Decile 3 | 0.000746 |
| Decile 2 | 0.000739 |
| Decile 1 | 0.00073 |
| Minimum | 0.000614 |
|
|
- Mean = 0.000761341
- Std.dev = 2.6863e-05
- 3 items below graph minimum of 0.000664
- 8 items above graph maximum of 0.000862
|
Notes
Mean MD (mean diffusivity) in cingulum cingulate gyrus (left) on FA (fractional anisotropy) skeleton (from dMRI data)
0 Related Data-Fields
There are no related data-fields
2 Applications
| Application ID | Title |
|---|
| 17689 | Genetic, environmental and lifestyle predictors of brain/cognitive-related outcomes. |
| 22783 | The joint analysis of imaging data and genetic data for early tumor detection, prevention, diagnosis and treatment |

