Data
83,911 items of data are available, covering 79,384 participants.
Defined-instances run from 2 to 3, labelled using Instancing
2.
Units of measurement are AU.
| Maximum | 0.002276 |
| Decile 9 | 0.000803 |
| Decile 8 | 0.000788 |
| Decile 7 | 0.000777 |
| Decile 6 | 0.000769 |
| Median | 0.00076 |
| Decile 4 | 0.000752 |
| Decile 3 | 0.000744 |
| Decile 2 | 0.000734 |
| Decile 1 | 0.00072 |
| Minimum | 0 |
|

|
- Mean = 0.000761451
- Std.dev = 3.66382e-05
- 38 items below graph minimum of 0.000637
- 230 items above graph maximum of 0.000886
|
2 Instances
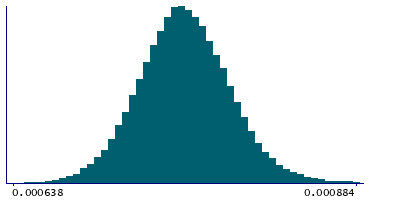
Instance 2 : Imaging visit (2014+)
79,153 participants, 79,153 items
| Maximum | 0.002276 |
| Decile 9 | 0.000804 |
| Decile 8 | 0.000788 |
| Decile 7 | 0.000778 |
| Decile 6 | 0.000769 |
| Median | 0.000761 |
| Decile 4 | 0.000753 |
| Decile 3 | 0.000744 |
| Decile 2 | 0.000734 |
| Decile 1 | 0.00072 |
| Minimum | 0 |
|
|
- Mean = 0.000761883
- Std.dev = 3.65451e-05
- 34 items below graph minimum of 0.000636
- 213 items above graph maximum of 0.000888
|
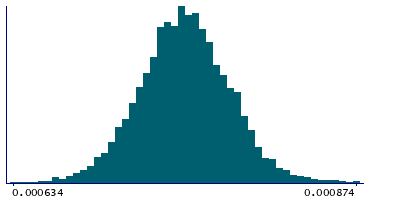
Instance 3 : First repeat imaging visit (2019+)
4,758 participants, 4,758 items
| Maximum | 0.002025 |
| Decile 9 | 0.000794 |
| Decile 8 | 0.00078 |
| Decile 7 | 0.00077 |
| Decile 6 | 0.000761 |
| Median | 0.000754 |
| Decile 4 | 0.000746 |
| Decile 3 | 0.000738 |
| Decile 2 | 0.000728 |
| Decile 1 | 0.000714 |
| Minimum | 0.000608 |
|
|
- Mean = 0.00075427
- Std.dev = 3.74302e-05
- 2 items below graph minimum of 0.000634
- 9 items above graph maximum of 0.000874
|
Notes
Mean MD (mean diffusivity) in cingulum hippocampus (right) on FA (fractional anisotropy) skeleton (from dMRI data)
0 Related Data-Fields
There are no related data-fields
2 Applications
| Application ID | Title |
|---|
| 17689 | Genetic, environmental and lifestyle predictors of brain/cognitive-related outcomes. |
| 22783 | The joint analysis of imaging data and genetic data for early tumor detection, prevention, diagnosis and treatment |

