Data
83,911 items of data are available, covering 79,384 participants.
Defined-instances run from 2 to 3, labelled using Instancing
2.
Units of measurement are AU.
| Maximum | 0.001836 |
| Decile 9 | 0.000935 |
| Decile 8 | 0.0009 |
| Decile 7 | 0.00088 |
| Decile 6 | 0.000866 |
| Median | 0.000853 |
| Decile 4 | 0.000842 |
| Decile 3 | 0.000831 |
| Decile 2 | 0.000818 |
| Decile 1 | 0.000801 |
| Minimum | 0 |
|
|
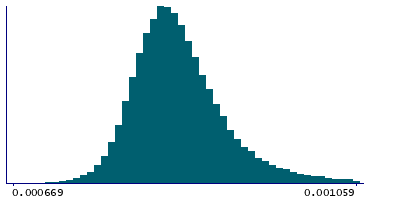
- Mean = 0.000864145
- Std.dev = 6.53595e-05
- 8 items below graph minimum of 0.000667
- 1249 items above graph maximum of 0.001069
|
2 Instances
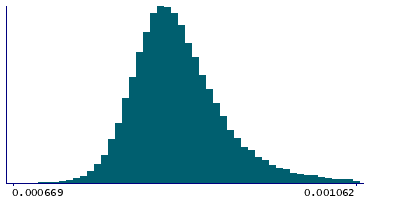
Instance 2 : Imaging visit (2014+)
79,153 participants, 79,153 items
| Maximum | 0.001836 |
| Decile 9 | 0.000937 |
| Decile 8 | 0.000901 |
| Decile 7 | 0.000882 |
| Decile 6 | 0.000867 |
| Median | 0.000854 |
| Decile 4 | 0.000843 |
| Decile 3 | 0.000832 |
| Decile 2 | 0.000819 |
| Decile 1 | 0.000802 |
| Minimum | 0 |
|
|
- Mean = 0.000865319
- Std.dev = 6.57003e-05
- 8 items below graph minimum of 0.000667
- 1166 items above graph maximum of 0.001072
|
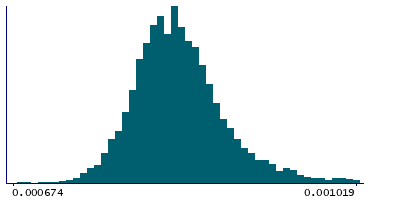
Instance 3 : First repeat imaging visit (2019+)
4,758 participants, 4,758 items
| Maximum | 0.001426 |
| Decile 9 | 0.000904 |
| Decile 8 | 0.000876 |
| Decile 7 | 0.00086 |
| Decile 6 | 0.000848 |
| Median | 0.000837 |
| Decile 4 | 0.000826 |
| Decile 3 | 0.000816 |
| Decile 2 | 0.000805 |
| Decile 1 | 0.000789 |
| Minimum | 0.000672 |
|
|
- Mean = 0.00084461
- Std.dev = 5.58949e-05
- 1 item below graph minimum of 0.000674
- 72 items above graph maximum of 0.001019
|
Notes
Mean MD (mean diffusivity) in fornix cres+stria terminalis (right) on FA (fractional anisotropy) skeleton (from dMRI data)
0 Related Data-Fields
There are no related data-fields
2 Applications
| Application ID | Title |
|---|
| 17689 | Genetic, environmental and lifestyle predictors of brain/cognitive-related outcomes. |
| 22783 | The joint analysis of imaging data and genetic data for early tumor detection, prevention, diagnosis and treatment |

