Data
83,911 items of data are available, covering 79,384 participants.
Defined-instances run from 2 to 3, labelled using Instancing
2.
Units of measurement are AU.
| Maximum | 0.00314 |
| Decile 9 | 0.001252 |
| Decile 8 | 0.001157 |
| Decile 7 | 0.001101 |
| Decile 6 | 0.001061 |
| Median | 0.001027 |
| Decile 4 | 0.000997 |
| Decile 3 | 0.000968 |
| Decile 2 | 0.000936 |
| Decile 1 | 0.000897 |
| Minimum | 0 |
|
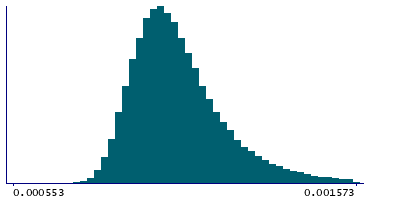
|
- Mean = 0.00105624
- Std.dev = 0.000152651
- 4 items below graph minimum of 0.000542
- 560 items above graph maximum of 0.001607
|
2 Instances
Instance 2 : Imaging visit (2014+)
79,153 participants, 79,153 items
| Maximum | 0.00314 |
| Decile 9 | 0.0012545 |
| Decile 8 | 0.001158 |
| Decile 7 | 0.001103 |
| Decile 6 | 0.001062 |
| Median | 0.001029 |
| Decile 4 | 0.000998 |
| Decile 3 | 0.000969 |
| Decile 2 | 0.000937 |
| Decile 1 | 0.000898 |
| Minimum | 0 |
|
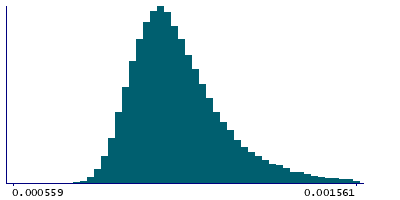
|
- Mean = 0.00105762
- Std.dev = 0.000153161
- 4 items below graph minimum of 0.0005415
- 523 items above graph maximum of 0.001611
|
Instance 3 : First repeat imaging visit (2019+)
4,758 participants, 4,758 items
| Maximum | 0.001922 |
| Decile 9 | 0.001215 |
| Decile 8 | 0.001127 |
| Decile 7 | 0.001078 |
| Decile 6 | 0.001039 |
| Median | 0.001008 |
| Decile 4 | 0.00098 |
| Decile 3 | 0.0009505 |
| Decile 2 | 0.00092 |
| Decile 1 | 0.000882 |
| Minimum | 0.000716 |
|
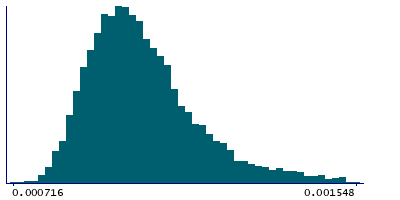
|
- Mean = 0.00103324
- Std.dev = 0.000141941
- 29 items above graph maximum of 0.001548
|
Notes
Mean MD (mean diffusivity) in tapetum (right) on FA (fractional anisotropy) skeleton (from dMRI data)
0 Related Data-Fields
There are no related data-fields
2 Applications
| Application ID | Title |
|---|
| 17689 | Genetic, environmental and lifestyle predictors of brain/cognitive-related outcomes. |
| 22783 | The joint analysis of imaging data and genetic data for early tumor detection, prevention, diagnosis and treatment |

