Data
83,911 items of data are available, covering 79,384 participants.
Defined-instances run from 2 to 3, labelled using Instancing
2.
Units of measurement are AU.
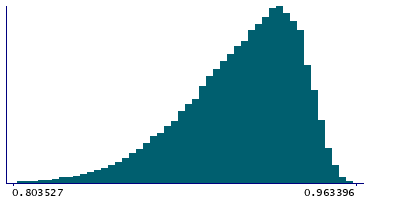
| Maximum | 0.963422 |
| Decile 9 | 0.939612 |
| Decile 8 | 0.933091 |
| Decile 7 | 0.927298 |
| Decile 6 | 0.921579 |
| Median | 0.915293 |
| Decile 4 | 0.908258 |
| Decile 3 | 0.899995 |
| Decile 2 | 0.88969 |
| Decile 1 | 0.87363 |
| Minimum | 0.059432 |
|
|
- Mean = 0.910109
- Std.dev = 0.0288381
- 233 items below graph minimum of 0.807647
|
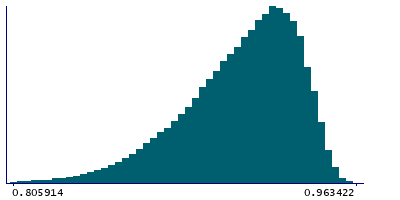
2 Instances
Instance 2 : Imaging visit (2014+)
79,153 participants, 79,153 items
| Maximum | 0.963422 |
| Decile 9 | 0.93962 |
| Decile 8 | 0.933115 |
| Decile 7 | 0.92733 |
| Decile 6 | 0.921634 |
| Median | 0.915395 |
| Decile 4 | 0.908329 |
| Decile 3 | 0.900129 |
| Decile 2 | 0.889806 |
| Decile 1 | 0.873722 |
| Minimum | 0.059432 |
|
|
- Mean = 0.91019
- Std.dev = 0.0286952
- 220 items below graph minimum of 0.807824
|
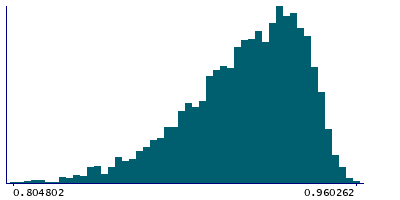
Instance 3 : First repeat imaging visit (2019+)
4,758 participants, 4,758 items
| Maximum | 0.960262 |
| Decile 9 | 0.939493 |
| Decile 8 | 0.932762 |
| Decile 7 | 0.926813 |
| Decile 6 | 0.920744 |
| Median | 0.913836 |
| Decile 4 | 0.906609 |
| Decile 3 | 0.89802 |
| Decile 2 | 0.887597 |
| Decile 1 | 0.872143 |
| Minimum | 0.108853 |
|
|
- Mean = 0.908768
- Std.dev = 0.0310887
- 16 items below graph minimum of 0.804793
|
Notes
Mean MO (diffusion tensor mode) in splenium of corpus callosum on FA (fractional anisotropy) skeleton (from dMRI data)
0 Related Data-Fields
There are no related data-fields
2 Applications
| Application ID | Title |
|---|
| 17689 | Genetic, environmental and lifestyle predictors of brain/cognitive-related outcomes. |
| 22783 | The joint analysis of imaging data and genetic data for early tumor detection, prevention, diagnosis and treatment |

