Data
83,911 items of data are available, covering 79,384 participants.
Defined-instances run from 2 to 3, labelled using Instancing
2.
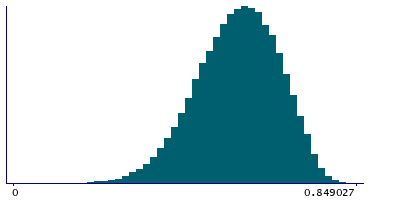
Units of measurement are AU.
| Maximum | 0.850258 |
| Decile 9 | 0.684732 |
| Decile 8 | 0.647382 |
| Decile 7 | 0.617301 |
| Decile 6 | 0.590232 |
| Median | 0.56382 |
| Decile 4 | 0.536303 |
| Decile 3 | 0.506332 |
| Decile 2 | 0.470948 |
| Decile 1 | 0.421726 |
| Minimum | -0.106346 |
|

|
- Mean = 0.557114
- Std.dev = 0.101883
- 1 item below graph minimum of 0
|
2 Instances
Instance 2 : Imaging visit (2014+)
79,153 participants, 79,153 items
| Maximum | 0.850258 |
| Decile 9 | 0.685123 |
| Decile 8 | 0.648019 |
| Decile 7 | 0.618057 |
| Decile 6 | 0.590934 |
| Median | 0.564491 |
| Decile 4 | 0.537063 |
| Decile 3 | 0.507024 |
| Decile 2 | 0.471484 |
| Decile 1 | 0.422153 |
| Minimum | 0.070096 |
|
|
- Mean = 0.557691
- Std.dev = 0.101816
|
Instance 3 : First repeat imaging visit (2019+)
4,758 participants, 4,758 items
| Maximum | 0.830926 |
| Decile 9 | 0.677071 |
| Decile 8 | 0.636484 |
| Decile 7 | 0.606332 |
| Decile 6 | 0.57956 |
| Median | 0.552576 |
| Decile 4 | 0.525132 |
| Decile 3 | 0.495922 |
| Decile 2 | 0.461148 |
| Decile 1 | 0.414844 |
| Minimum | -0.106346 |
|

|
- Mean = 0.547524
- Std.dev = 0.102508
- 1 item below graph minimum of 0
|
Notes
Mean MO (diffusion tensor mode) in superior corona radiata (left) on FA (fractional anisotropy) skeleton (from dMRI data)
0 Related Data-Fields
There are no related data-fields
2 Applications
| Application ID | Title |
|---|
| 17689 | Genetic, environmental and lifestyle predictors of brain/cognitive-related outcomes. |
| 22783 | The joint analysis of imaging data and genetic data for early tumor detection, prevention, diagnosis and treatment |

