Data
83,911 items of data are available, covering 79,384 participants.
Defined-instances run from 2 to 3, labelled using Instancing
2.
Units of measurement are AU.
| Maximum | 0.003067 |
| Decile 9 | 0.001672 |
| Decile 8 | 0.001653 |
| Decile 7 | 0.001638 |
| Decile 6 | 0.001626 |
| Median | 0.001615 |
| Decile 4 | 0.001603 |
| Decile 3 | 0.001591 |
| Decile 2 | 0.001577 |
| Decile 1 | 0.001556 |
| Minimum | 0.000604 |
|

|
- Mean = 0.00161414
- Std.dev = 4.82489e-05
- 121 items below graph minimum of 0.00144
- 24 items above graph maximum of 0.001788
|
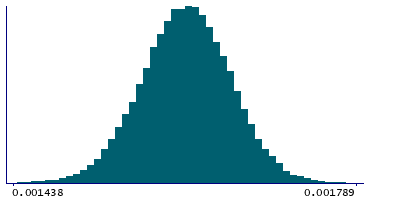
2 Instances
Instance 2 : Imaging visit (2014+)
79,153 participants, 79,153 items
| Maximum | 0.003067 |
| Decile 9 | 0.001672 |
| Decile 8 | 0.001653 |
| Decile 7 | 0.001638 |
| Decile 6 | 0.001626 |
| Median | 0.001615 |
| Decile 4 | 0.001603 |
| Decile 3 | 0.001591 |
| Decile 2 | 0.001577 |
| Decile 1 | 0.001556 |
| Minimum | 0.000604 |
|
|
- Mean = 0.00161415
- Std.dev = 4.83888e-05
- 116 items below graph minimum of 0.00144
- 23 items above graph maximum of 0.001788
|
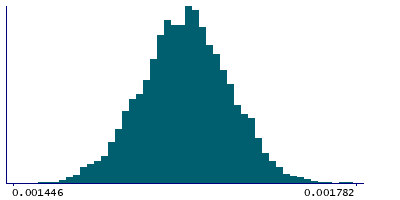
Instance 3 : First repeat imaging visit (2019+)
4,758 participants, 4,758 items
| Maximum | 0.001895 |
| Decile 9 | 0.00167 |
| Decile 8 | 0.001651 |
| Decile 7 | 0.001637 |
| Decile 6 | 0.001625 |
| Median | 0.001615 |
| Decile 4 | 0.001603 |
| Decile 3 | 0.001592 |
| Decile 2 | 0.001578 |
| Decile 1 | 0.001558 |
| Minimum | 0.000875 |
|
|
- Mean = 0.00161397
- Std.dev = 4.58596e-05
- 5 items below graph minimum of 0.001446
- 1 item above graph maximum of 0.001782
|
Notes
Mean L1 in body of corpus callosum on FA (fractional anisotropy) skeleton (from dMRI data)
0 Related Data-Fields
There are no related data-fields
2 Applications
| Application ID | Title |
|---|
| 17689 | Genetic, environmental and lifestyle predictors of brain/cognitive-related outcomes. |
| 22783 | The joint analysis of imaging data and genetic data for early tumor detection, prevention, diagnosis and treatment |

