Data
83,911 items of data are available, covering 79,384 participants.
Defined-instances run from 2 to 3, labelled using Instancing
2.
Units of measurement are AU.
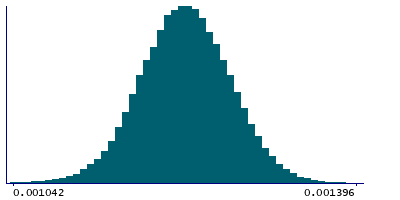
| Maximum | 0.002685 |
| Decile 9 | 0.001278 |
| Decile 8 | 0.001257 |
| Decile 7 | 0.001243 |
| Decile 6 | 0.00123 |
| Median | 0.001218 |
| Decile 4 | 0.001206 |
| Decile 3 | 0.001194 |
| Decile 2 | 0.001179 |
| Decile 1 | 0.001159 |
| Minimum | 0 |
|
|
- Mean = 0.00121775
- Std.dev = 5.01211e-05
- 226 items below graph minimum of 0.00104
- 66 items above graph maximum of 0.001397
|
2 Instances
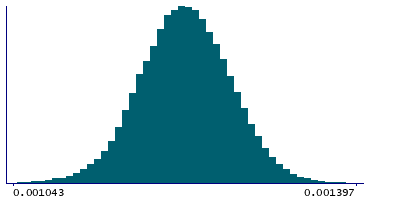
Instance 2 : Imaging visit (2014+)
79,153 participants, 79,153 items
| Maximum | 0.002685 |
| Decile 9 | 0.001278 |
| Decile 8 | 0.001258 |
| Decile 7 | 0.001243 |
| Decile 6 | 0.001231 |
| Median | 0.001219 |
| Decile 4 | 0.001207 |
| Decile 3 | 0.001195 |
| Decile 2 | 0.00118 |
| Decile 1 | 0.001159 |
| Minimum | 0 |
|
|
- Mean = 0.00121831
- Std.dev = 5.01512e-05
- 206 items below graph minimum of 0.00104
- 62 items above graph maximum of 0.001397
|
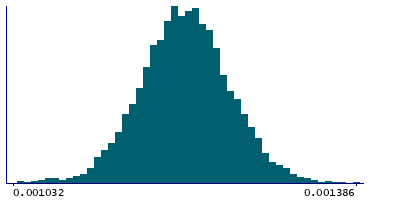
Instance 3 : First repeat imaging visit (2019+)
4,758 participants, 4,758 items
| Maximum | 0.001441 |
| Decile 9 | 0.001268 |
| Decile 8 | 0.001246 |
| Decile 7 | 0.001232 |
| Decile 6 | 0.001221 |
| Median | 0.001209 |
| Decile 4 | 0.001198 |
| Decile 3 | 0.001185 |
| Decile 2 | 0.001171 |
| Decile 1 | 0.00115 |
| Minimum | 0.000879 |
|
|
- Mean = 0.00120835
- Std.dev = 4.86632e-05
- 17 items below graph minimum of 0.001032
- 5 items above graph maximum of 0.001386
|
Notes
Mean L1 in inferior cerebellar peduncle (right) on FA (fractional anisotropy) skeleton (from dMRI data)
0 Related Data-Fields
There are no related data-fields
2 Applications
| Application ID | Title |
|---|
| 17689 | Genetic, environmental and lifestyle predictors of brain/cognitive-related outcomes. |
| 22783 | The joint analysis of imaging data and genetic data for early tumor detection, prevention, diagnosis and treatment |

