Data
83,911 items of data are available, covering 79,384 participants.
Defined-instances run from 2 to 3, labelled using Instancing
2.
Units of measurement are AU.
| Maximum | 0.002327 |
| Decile 9 | 0.001241 |
| Decile 8 | 0.001217 |
| Decile 7 | 0.0012 |
| Decile 6 | 0.001185 |
| Median | 0.001172 |
| Decile 4 | 0.001158 |
| Decile 3 | 0.001144 |
| Decile 2 | 0.001126 |
| Decile 1 | 0.001101 |
| Minimum | 0 |
|

|
- Mean = 0.00117149
- Std.dev = 5.63568e-05
- 36 items below graph minimum of 0.000961
- 68 items above graph maximum of 0.001381
|
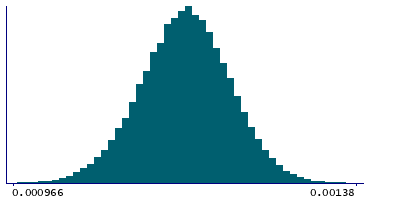
2 Instances
Instance 2 : Imaging visit (2014+)
79,153 participants, 79,153 items
| Maximum | 0.002327 |
| Decile 9 | 0.001241 |
| Decile 8 | 0.001217 |
| Decile 7 | 0.0012 |
| Decile 6 | 0.001186 |
| Median | 0.001172 |
| Decile 4 | 0.001159 |
| Decile 3 | 0.001144 |
| Decile 2 | 0.001126 |
| Decile 1 | 0.001101 |
| Minimum | 0 |
|
|
- Mean = 0.00117187
- Std.dev = 5.64824e-05
- 32 items below graph minimum of 0.000961
- 65 items above graph maximum of 0.001381
|
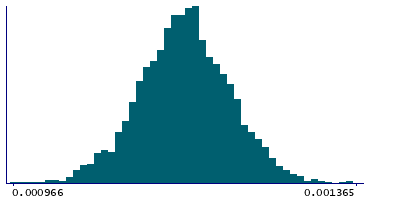
Instance 3 : First repeat imaging visit (2019+)
4,758 participants, 4,758 items
| Maximum | 0.00153 |
| Decile 9 | 0.001232 |
| Decile 8 | 0.001209 |
| Decile 7 | 0.001191 |
| Decile 6 | 0.001177 |
| Median | 0.001165 |
| Decile 4 | 0.001152 |
| Decile 3 | 0.001139 |
| Decile 2 | 0.001122 |
| Decile 1 | 0.001099 |
| Minimum | 0.000892 |
|
|
- Mean = 0.0011651
- Std.dev = 5.38255e-05
- 4 items below graph minimum of 0.000966
- 3 items above graph maximum of 0.001365
|
Notes
Mean L1 in cingulum hippocampus (left) on FA (fractional anisotropy) skeleton (from dMRI data)
0 Related Data-Fields
There are no related data-fields
2 Applications
| Application ID | Title |
|---|
| 17689 | Genetic, environmental and lifestyle predictors of brain/cognitive-related outcomes. |
| 22783 | The joint analysis of imaging data and genetic data for early tumor detection, prevention, diagnosis and treatment |

