Data
83,911 items of data are available, covering 79,384 participants.
Defined-instances run from 2 to 3, labelled using Instancing
2.
Units of measurement are AU.
| Maximum | 0.002199 |
| Decile 9 | 0.00148 |
| Decile 8 | 0.001447 |
| Decile 7 | 0.001426 |
| Decile 6 | 0.001409 |
| Median | 0.001393 |
| Decile 4 | 0.001378 |
| Decile 3 | 0.001361 |
| Decile 2 | 0.001342 |
| Decile 1 | 0.001314 |
| Minimum | 0 |
|

|
- Mean = 0.00139652
- Std.dev = 7.27441e-05
- 71 items below graph minimum of 0.001148
- 494 items above graph maximum of 0.001646
|
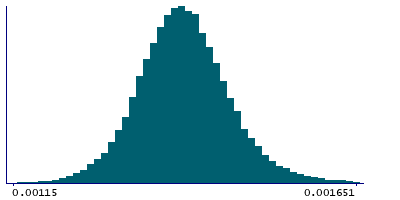
2 Instances
Instance 2 : Imaging visit (2014+)
79,153 participants, 79,153 items
| Maximum | 0.002199 |
| Decile 9 | 0.001482 |
| Decile 8 | 0.001449 |
| Decile 7 | 0.001427 |
| Decile 6 | 0.00141 |
| Median | 0.001394 |
| Decile 4 | 0.001379 |
| Decile 3 | 0.001362 |
| Decile 2 | 0.001343 |
| Decile 1 | 0.001315 |
| Minimum | 0 |
|
|
- Mean = 0.00139777
- Std.dev = 7.30064e-05
- 64 items below graph minimum of 0.001148
- 463 items above graph maximum of 0.001649
|
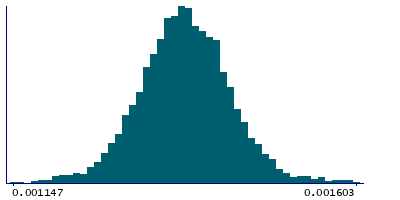
Instance 3 : First repeat imaging visit (2019+)
4,758 participants, 4,758 items
| Maximum | 0.001884 |
| Decile 9 | 0.001451 |
| Decile 8 | 0.001423 |
| Decile 7 | 0.001406 |
| Decile 6 | 0.001389 |
| Median | 0.001375 |
| Decile 4 | 0.00136 |
| Decile 3 | 0.001345 |
| Decile 2 | 0.001326 |
| Decile 1 | 0.001299 |
| Minimum | 0.001005 |
|
|
- Mean = 0.00137577
- Std.dev = 6.48018e-05
- 4 items below graph minimum of 0.001147
- 23 items above graph maximum of 0.001603
|
Notes
Mean L1 in fornix cres+stria terminalis (right) on FA (fractional anisotropy) skeleton (from dMRI data)
0 Related Data-Fields
There are no related data-fields
2 Applications
| Application ID | Title |
|---|
| 17689 | Genetic, environmental and lifestyle predictors of brain/cognitive-related outcomes. |
| 22783 | The joint analysis of imaging data and genetic data for early tumor detection, prevention, diagnosis and treatment |

