Data
83,911 items of data are available, covering 79,384 participants.
Defined-instances run from 2 to 3, labelled using Instancing
2.
Units of measurement are AU.
| Maximum | 0.002283 |
| Decile 9 | 0.001433 |
| Decile 8 | 0.001402 |
| Decile 7 | 0.001381 |
| Decile 6 | 0.001364 |
| Median | 0.001348 |
| Decile 4 | 0.001332 |
| Decile 3 | 0.001315 |
| Decile 2 | 0.001294 |
| Decile 1 | 0.001263 |
| Minimum | 0 |
|

|
- Mean = 0.00134967
- Std.dev = 7.51327e-05
- 50 items below graph minimum of 0.001093
- 544 items above graph maximum of 0.001603
|
2 Instances
Instance 2 : Imaging visit (2014+)
79,153 participants, 79,153 items
| Maximum | 0.002283 |
| Decile 9 | 0.001434 |
| Decile 8 | 0.001403 |
| Decile 7 | 0.001382 |
| Decile 6 | 0.001365 |
| Median | 0.001348 |
| Decile 4 | 0.001332 |
| Decile 3 | 0.001315 |
| Decile 2 | 0.001294 |
| Decile 1 | 0.001263 |
| Minimum | 0 |
|
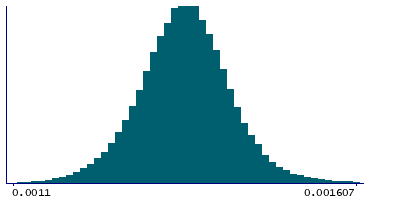
|
- Mean = 0.00135019
- Std.dev = 7.55838e-05
- 46 items below graph minimum of 0.001092
- 513 items above graph maximum of 0.001605
|
Instance 3 : First repeat imaging visit (2019+)
4,758 participants, 4,758 items
| Maximum | 0.002038 |
| Decile 9 | 0.001414 |
| Decile 8 | 0.001387 |
| Decile 7 | 0.00137 |
| Decile 6 | 0.001355 |
| Median | 0.001342 |
| Decile 4 | 0.001328 |
| Decile 3 | 0.001312 |
| Decile 2 | 0.001292 |
| Decile 1 | 0.001263 |
| Minimum | 0.001045 |
|
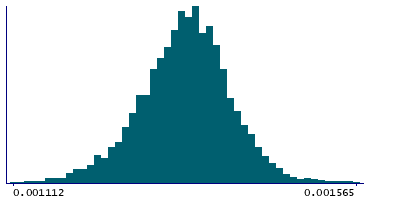
|
- Mean = 0.00134089
- Std.dev = 6.65752e-05
- 3 items below graph minimum of 0.001112
- 38 items above graph maximum of 0.001565
|
Notes
Mean L1 in fornix cres+stria terminalis (left) on FA (fractional anisotropy) skeleton (from dMRI data)
0 Related Data-Fields
There are no related data-fields
2 Applications
| Application ID | Title |
|---|
| 17689 | Genetic, environmental and lifestyle predictors of brain/cognitive-related outcomes. |
| 22783 | The joint analysis of imaging data and genetic data for early tumor detection, prevention, diagnosis and treatment |

