Data
83,911 items of data are available, covering 79,384 participants.
Defined-instances run from 2 to 3, labelled using Instancing
2.
Units of measurement are AU.
| Maximum | 0.003573 |
| Decile 9 | 0.001884 |
| Decile 8 | 0.001791 |
| Decile 7 | 0.001733 |
| Decile 6 | 0.001687 |
| Median | 0.001646 |
| Decile 4 | 0.001608 |
| Decile 3 | 0.00157 |
| Decile 2 | 0.001527 |
| Decile 1 | 0.001469 |
| Minimum | 0 |
|
|
- Mean = 0.00166507
- Std.dev = 0.000171299
- 6 items below graph minimum of 0.001054
- 292 items above graph maximum of 0.002299
|
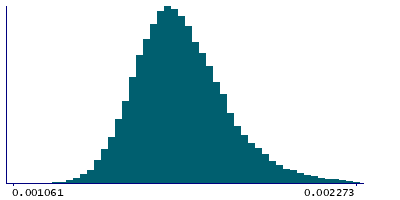
2 Instances
Instance 2 : Imaging visit (2014+)
79,153 participants, 79,153 items
| Maximum | 0.003573 |
| Decile 9 | 0.001886 |
| Decile 8 | 0.001793 |
| Decile 7 | 0.001735 |
| Decile 6 | 0.001689 |
| Median | 0.001648 |
| Decile 4 | 0.00161 |
| Decile 3 | 0.001572 |
| Decile 2 | 0.001529 |
| Decile 1 | 0.001471 |
| Minimum | 0 |
|

|
- Mean = 0.00166696
- Std.dev = 0.000171753
- 6 items below graph minimum of 0.001056
- 280 items above graph maximum of 0.002301
|
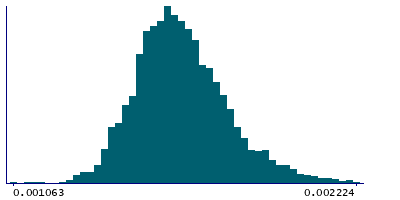
Instance 3 : First repeat imaging visit (2019+)
4,758 participants, 4,758 items
| Maximum | 0.002414 |
| Decile 9 | 0.001836 |
| Decile 8 | 0.001753 |
| Decile 7 | 0.001699 |
| Decile 6 | 0.001656 |
| Median | 0.001617 |
| Decile 4 | 0.001581 |
| Decile 3 | 0.0015445 |
| Decile 2 | 0.001504 |
| Decile 1 | 0.0014475 |
| Minimum | 0.001063 |
|
|
- Mean = 0.00163376
- Std.dev = 0.000160353
- 19 items above graph maximum of 0.0022245
|
Notes
Mean L1 in tapetum (left) on FA (fractional anisotropy) skeleton (from dMRI data)
0 Related Data-Fields
There are no related data-fields
2 Applications
| Application ID | Title |
|---|
| 17689 | Genetic, environmental and lifestyle predictors of brain/cognitive-related outcomes. |
| 22783 | The joint analysis of imaging data and genetic data for early tumor detection, prevention, diagnosis and treatment |

