Data
83,911 items of data are available, covering 79,384 participants.
Defined-instances run from 2 to 3, labelled using Instancing
2.
Units of measurement are AU.
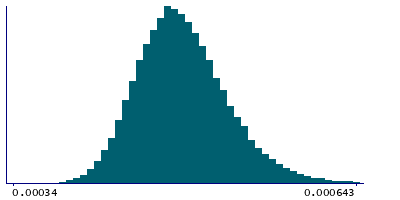
| Maximum | 0.00137 |
| Decile 9 | 0.000543 |
| Decile 8 | 0.000522 |
| Decile 7 | 0.000507 |
| Decile 6 | 0.000496 |
| Median | 0.000486 |
| Decile 4 | 0.000477 |
| Decile 3 | 0.000467 |
| Decile 2 | 0.000456 |
| Decile 1 | 0.000441 |
| Minimum | 0 |
|
|
- Mean = 0.000489987
- Std.dev = 4.22759e-05
- 3 items below graph minimum of 0.000339
- 249 items above graph maximum of 0.000645
|
2 Instances
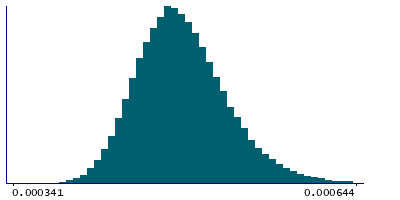
Instance 2 : Imaging visit (2014+)
79,153 participants, 79,153 items
| Maximum | 0.00137 |
| Decile 9 | 0.000543 |
| Decile 8 | 0.000522 |
| Decile 7 | 0.000508 |
| Decile 6 | 0.000497 |
| Median | 0.000487 |
| Decile 4 | 0.000477 |
| Decile 3 | 0.000467 |
| Decile 2 | 0.000456 |
| Decile 1 | 0.000441 |
| Minimum | 0 |
|
|
- Mean = 0.000490366
- Std.dev = 4.23948e-05
- 3 items below graph minimum of 0.000339
- 242 items above graph maximum of 0.000645
|
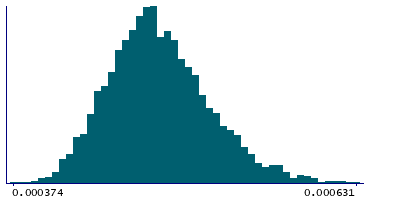
Instance 3 : First repeat imaging visit (2019+)
4,758 participants, 4,758 items
| Maximum | 0.000949 |
| Decile 9 | 0.000534 |
| Decile 8 | 0.000514 |
| Decile 7 | 0.0005 |
| Decile 6 | 0.0004895 |
| Median | 0.000479 |
| Decile 4 | 0.000471 |
| Decile 3 | 0.000462 |
| Decile 2 | 0.000452 |
| Decile 1 | 0.000437 |
| Minimum | 0.000374 |
|
|
- Mean = 0.000483693
- Std.dev = 3.97206e-05
- 13 items above graph maximum of 0.000631
|
Notes
Mean L2 in superior cerebellar peduncle (right) on FA (fractional anisotropy) skeleton (from dMRI data)
0 Related Data-Fields
There are no related data-fields
2 Applications
| Application ID | Title |
|---|
| 17689 | Genetic, environmental and lifestyle predictors of brain/cognitive-related outcomes. |
| 22783 | The joint analysis of imaging data and genetic data for early tumor detection, prevention, diagnosis and treatment |

