Data
83,911 items of data are available, covering 79,384 participants.
Defined-instances run from 2 to 3, labelled using Instancing
2.
Units of measurement are AU.
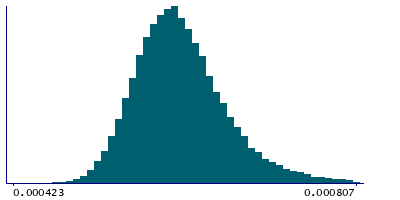
| Maximum | 0.002039 |
| Decile 9 | 0.000692 |
| Decile 8 | 0.000659 |
| Decile 7 | 0.000639 |
| Decile 6 | 0.000624 |
| Median | 0.000611 |
| Decile 4 | 0.000599 |
| Decile 3 | 0.000586 |
| Decile 2 | 0.000572 |
| Decile 1 | 0.000554 |
| Minimum | 0 |
|
|
- Mean = 0.000618983
- Std.dev = 5.96437e-05
- 3 items below graph minimum of 0.000416
- 564 items above graph maximum of 0.00083
|
2 Instances
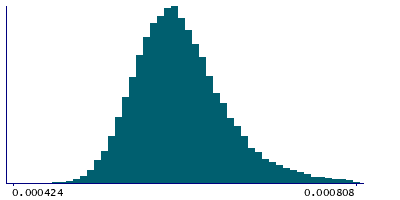
Instance 2 : Imaging visit (2014+)
79,153 participants, 79,153 items
| Maximum | 0.002039 |
| Decile 9 | 0.000693 |
| Decile 8 | 0.00066 |
| Decile 7 | 0.00064 |
| Decile 6 | 0.000625 |
| Median | 0.000612 |
| Decile 4 | 0.000599 |
| Decile 3 | 0.000587 |
| Decile 2 | 0.000573 |
| Decile 1 | 0.000555 |
| Minimum | 0 |
|
|
- Mean = 0.000619879
- Std.dev = 5.99257e-05
- 3 items below graph minimum of 0.000417
- 540 items above graph maximum of 0.000831
|
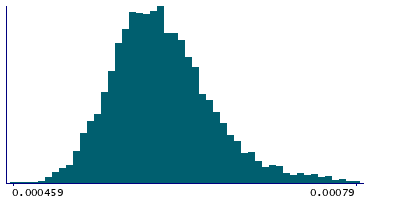
Instance 3 : First repeat imaging visit (2019+)
4,758 participants, 4,758 items
| Maximum | 0.000951 |
| Decile 9 | 0.000668 |
| Decile 8 | 0.00064 |
| Decile 7 | 0.000623 |
| Decile 6 | 0.00061 |
| Median | 0.000598 |
| Decile 4 | 0.000587 |
| Decile 3 | 0.000575 |
| Decile 2 | 0.0005625 |
| Decile 1 | 0.000546 |
| Minimum | 0.000459 |
|
|
- Mean = 0.000604071
- Std.dev = 5.2542e-05
- 32 items above graph maximum of 0.00079
|
Notes
Mean L2 in posterior thalamic radiation (right) on FA (fractional anisotropy) skeleton (from dMRI data)
0 Related Data-Fields
There are no related data-fields
2 Applications
| Application ID | Title |
|---|
| 17689 | Genetic, environmental and lifestyle predictors of brain/cognitive-related outcomes. |
| 22783 | The joint analysis of imaging data and genetic data for early tumor detection, prevention, diagnosis and treatment |

