Data
83,911 items of data are available, covering 79,384 participants.
Defined-instances run from 2 to 3, labelled using Instancing
2.
Units of measurement are AU.
| Maximum | 0.001107 |
| Decile 9 | 0.000626 |
| Decile 8 | 0.000608 |
| Decile 7 | 0.000596 |
| Decile 6 | 0.000585 |
| Median | 0.000575 |
| Decile 4 | 0.000566 |
| Decile 3 | 0.000556 |
| Decile 2 | 0.000544 |
| Decile 1 | 0.000528 |
| Minimum | 0.000394 |
|

|
- Mean = 0.000576508
- Std.dev = 3.9109e-05
- 2 items below graph minimum of 0.00043
- 54 items above graph maximum of 0.000724
|
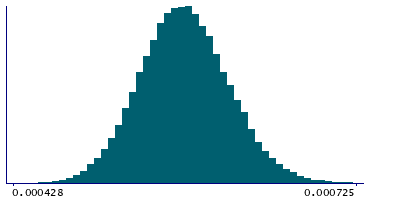
2 Instances
Instance 2 : Imaging visit (2014+)
79,153 participants, 79,153 items
| Maximum | 0.001107 |
| Decile 9 | 0.000627 |
| Decile 8 | 0.000609 |
| Decile 7 | 0.000596 |
| Decile 6 | 0.000585 |
| Median | 0.000576 |
| Decile 4 | 0.000566 |
| Decile 3 | 0.000556 |
| Decile 2 | 0.000544 |
| Decile 1 | 0.000528 |
| Minimum | 0.000394 |
|
|
- Mean = 0.000576626
- Std.dev = 3.92346e-05
- 2 items below graph minimum of 0.000429
- 52 items above graph maximum of 0.000726
|
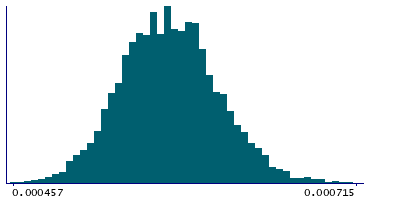
Instance 3 : First repeat imaging visit (2019+)
4,758 participants, 4,758 items
| Maximum | 0.000748 |
| Decile 9 | 0.000622 |
| Decile 8 | 0.000605 |
| Decile 7 | 0.000593 |
| Decile 6 | 0.000583 |
| Median | 0.000573 |
| Decile 4 | 0.000564 |
| Decile 3 | 0.000554 |
| Decile 2 | 0.000543 |
| Decile 1 | 0.000529 |
| Minimum | 0.000457 |
|
|
- Mean = 0.000574552
- Std.dev = 3.69038e-05
- 2 items above graph maximum of 0.000715
|
Notes
Mean L2 in cingulum cingulate gyrus (right) on FA (fractional anisotropy) skeleton (from dMRI data)
0 Related Data-Fields
There are no related data-fields
2 Applications
| Application ID | Title |
|---|
| 17689 | Genetic, environmental and lifestyle predictors of brain/cognitive-related outcomes. |
| 22783 | The joint analysis of imaging data and genetic data for early tumor detection, prevention, diagnosis and treatment |

