Data
83,911 items of data are available, covering 79,384 participants.
Defined-instances run from 2 to 3, labelled using Instancing
2.
Units of measurement are AU.
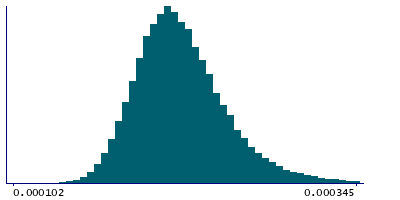
| Maximum | 0.001232 |
| Decile 9 | 0.000267 |
| Decile 8 | 0.000248 |
| Decile 7 | 0.000236 |
| Decile 6 | 0.000226 |
| Median | 0.000218 |
| Decile 4 | 0.00021 |
| Decile 3 | 0.000203 |
| Decile 2 | 0.000194 |
| Decile 1 | 0.000183 |
| Minimum | -0.000159 |
|
|
- Mean = 0.000222876
- Std.dev = 3.75942e-05
- 8 items below graph minimum of 9.9e-05
- 589 items above graph maximum of 0.000351
|
2 Instances
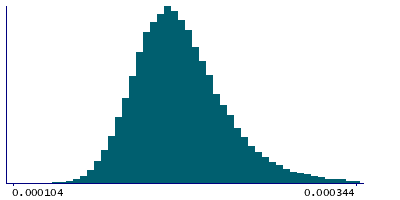
Instance 2 : Imaging visit (2014+)
79,153 participants, 79,153 items
| Maximum | 0.001232 |
| Decile 9 | 0.000268 |
| Decile 8 | 0.000248 |
| Decile 7 | 0.000236 |
| Decile 6 | 0.000226 |
| Median | 0.000218 |
| Decile 4 | 0.000211 |
| Decile 3 | 0.000203 |
| Decile 2 | 0.000194 |
| Decile 1 | 0.000183 |
| Minimum | -7.4e-05 |
|
|
- Mean = 0.000223082
- Std.dev = 3.77953e-05
- 7 items below graph minimum of 9.8e-05
- 540 items above graph maximum of 0.000353
|
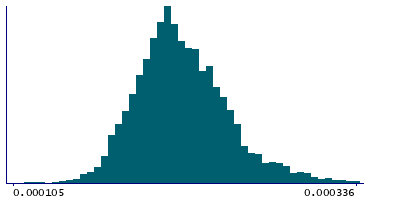
Instance 3 : First repeat imaging visit (2019+)
4,758 participants, 4,758 items
| Maximum | 0.000637 |
| Decile 9 | 0.000259 |
| Decile 8 | 0.000243 |
| Decile 7 | 0.000232 |
| Decile 6 | 0.000224 |
| Median | 0.000215 |
| Decile 4 | 0.000209 |
| Decile 3 | 0.000202 |
| Decile 2 | 0.000194 |
| Decile 1 | 0.000182 |
| Minimum | -0.000159 |
|
|
- Mean = 0.000219434
- Std.dev = 3.38904e-05
- 1 item below graph minimum of 0.000105
- 26 items above graph maximum of 0.000336
|
Notes
Mean L3 in splenium of corpus callosum on FA (fractional anisotropy) skeleton (from dMRI data)
0 Related Data-Fields
There are no related data-fields
2 Applications
| Application ID | Title |
|---|
| 17689 | Genetic, environmental and lifestyle predictors of brain/cognitive-related outcomes. |
| 22783 | The joint analysis of imaging data and genetic data for early tumor detection, prevention, diagnosis and treatment |

