Data
83,911 items of data are available, covering 79,384 participants.
Defined-instances run from 2 to 3, labelled using Instancing
2.
Units of measurement are AU.
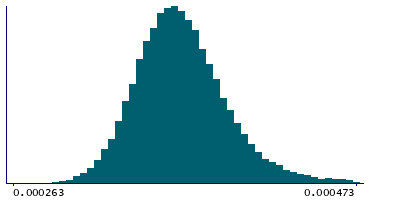
| Maximum | 0.00161 |
| Decile 9 | 0.000406 |
| Decile 8 | 0.00039 |
| Decile 7 | 0.00038 |
| Decile 6 | 0.000373 |
| Median | 0.000366 |
| Decile 4 | 0.000359 |
| Decile 3 | 0.000352 |
| Decile 2 | 0.000344 |
| Decile 1 | 0.000334 |
| Minimum | -2e-06 |
|
|
- Mean = 0.000369276
- Std.dev = 3.38318e-05
- 5 items below graph minimum of 0.000262
- 875 items above graph maximum of 0.000478
|
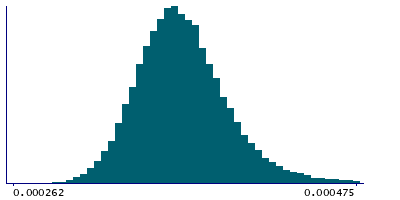
2 Instances
Instance 2 : Imaging visit (2014+)
79,153 participants, 79,153 items
| Maximum | 0.00161 |
| Decile 9 | 0.000406 |
| Decile 8 | 0.000391 |
| Decile 7 | 0.000381 |
| Decile 6 | 0.000373 |
| Median | 0.000366 |
| Decile 4 | 0.00036 |
| Decile 3 | 0.000353 |
| Decile 2 | 0.000345 |
| Decile 1 | 0.000334 |
| Minimum | 0 |
|
|
- Mean = 0.000369715
- Std.dev = 3.38557e-05
- 4 items below graph minimum of 0.000262
- 832 items above graph maximum of 0.000478
|
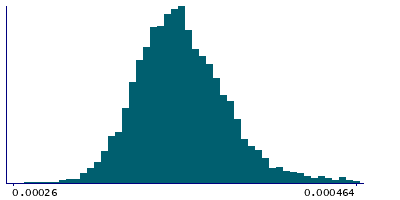
Instance 3 : First repeat imaging visit (2019+)
4,758 participants, 4,758 items
| Maximum | 0.000646 |
| Decile 9 | 0.000396 |
| Decile 8 | 0.000382 |
| Decile 7 | 0.000373 |
| Decile 6 | 0.000365 |
| Median | 0.000358 |
| Decile 4 | 0.000352 |
| Decile 3 | 0.000345 |
| Decile 2 | 0.000338 |
| Decile 1 | 0.000328 |
| Minimum | -2e-06 |
|
|
- Mean = 0.000361977
- Std.dev = 3.2575e-05
- 1 item below graph minimum of 0.00026
- 62 items above graph maximum of 0.000464
|
Notes
Mean L3 in inferior cerebellar peduncle (right) on FA (fractional anisotropy) skeleton (from dMRI data)
0 Related Data-Fields
There are no related data-fields
2 Applications
| Application ID | Title |
|---|
| 17689 | Genetic, environmental and lifestyle predictors of brain/cognitive-related outcomes. |
| 22783 | The joint analysis of imaging data and genetic data for early tumor detection, prevention, diagnosis and treatment |

