Data
83,906 items of data are available, covering 79,379 participants.
Defined-instances run from 2 to 3, labelled using Instancing
2.
Units of measurement are AU.
| Maximum | 0.99 |
| Decile 9 | 0.746223 |
| Decile 8 | 0.728519 |
| Decile 7 | 0.716354 |
| Decile 6 | 0.705696 |
| Median | 0.695652 |
| Decile 4 | 0.685401 |
| Decile 3 | 0.67423 |
| Decile 2 | 0.660554 |
| Decile 1 | 0.640043 |
| Minimum | 0 |
|
|
- Mean = 0.693973
- Std.dev = 0.0439661
- 216 items below graph minimum of 0.533862
- 51 items above graph maximum of 0.852404
|
2 Instances
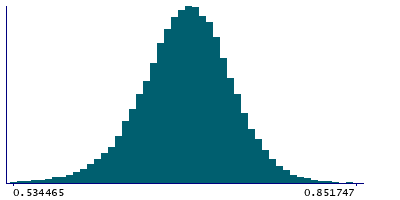
Instance 2 : Imaging visit (2014+)
79,148 participants, 79,148 items
| Maximum | 0.99 |
| Decile 9 | 0.746002 |
| Decile 8 | 0.728266 |
| Decile 7 | 0.716087 |
| Decile 6 | 0.705371 |
| Median | 0.695279 |
| Decile 4 | 0.68505 |
| Decile 3 | 0.673872 |
| Decile 2 | 0.660197 |
| Decile 1 | 0.639735 |
| Minimum | 0 |
|

|
- Mean = 0.693666
- Std.dev = 0.0440642
- 208 items below graph minimum of 0.533468
- 47 items above graph maximum of 0.852269
|
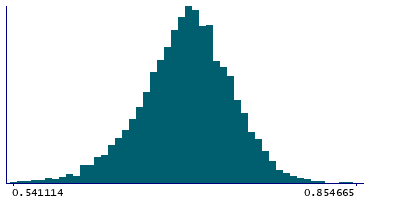
Instance 3 : First repeat imaging visit (2019+)
4,758 participants, 4,758 items
| Maximum | 0.981538 |
| Decile 9 | 0.750082 |
| Decile 8 | 0.732977 |
| Decile 7 | 0.720513 |
| Decile 6 | 0.710364 |
| Median | 0.701016 |
| Decile 4 | 0.691414 |
| Decile 3 | 0.680134 |
| Decile 2 | 0.666497 |
| Decile 1 | 0.645596 |
| Minimum | 0.509814 |
|
|
- Mean = 0.699089
- Std.dev = 0.0419725
- 2 items below graph minimum of 0.541111
- 4 items above graph maximum of 0.854567
|
Notes
Mean ICVF (intra-cellular volume fraction) in pontine crossing tract on FA (fractional anisotropy) skeleton (from dMRI data)
0 Related Data-Fields
There are no related data-fields
2 Applications
| Application ID | Title |
|---|
| 17689 | Genetic, environmental and lifestyle predictors of brain/cognitive-related outcomes. |
| 22783 | The joint analysis of imaging data and genetic data for early tumor detection, prevention, diagnosis and treatment |

