Data
83,906 items of data are available, covering 79,379 participants.
Defined-instances run from 2 to 3, labelled using Instancing
2.
Units of measurement are AU.
| Maximum | 0.989991 |
| Decile 9 | 0.699943 |
| Decile 8 | 0.686911 |
| Decile 7 | 0.677131 |
| Decile 6 | 0.668622 |
| Median | 0.660553 |
| Decile 4 | 0.652176 |
| Decile 3 | 0.642945 |
| Decile 2 | 0.631904 |
| Decile 1 | 0.615719 |
| Minimum | 0.294147 |
|
|
- Mean = 0.658892
- Std.dev = 0.0341341
- 93 items below graph minimum of 0.531495
- 39 items above graph maximum of 0.784166
|
2 Instances
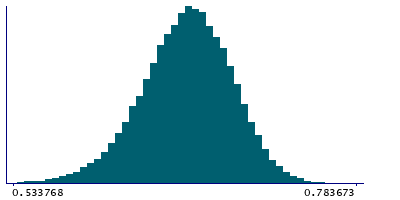
Instance 2 : Imaging visit (2014+)
79,148 participants, 79,148 items
| Maximum | 0.989991 |
| Decile 9 | 0.69992 |
| Decile 8 | 0.68687 |
| Decile 7 | 0.677083 |
| Decile 6 | 0.668597 |
| Median | 0.660532 |
| Decile 4 | 0.652095 |
| Decile 3 | 0.642767 |
| Decile 2 | 0.631698 |
| Decile 1 | 0.615504 |
| Minimum | 0.294147 |
|

|
- Mean = 0.658793
- Std.dev = 0.0342172
- 89 items below graph minimum of 0.531089
- 37 items above graph maximum of 0.784335
|
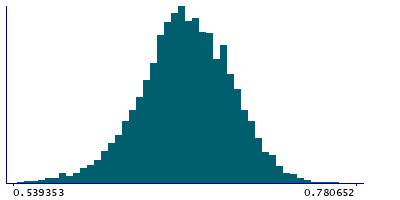
Instance 3 : First repeat imaging visit (2019+)
4,758 participants, 4,758 items
| Maximum | 0.986697 |
| Decile 9 | 0.700258 |
| Decile 8 | 0.687675 |
| Decile 7 | 0.677728 |
| Decile 6 | 0.669002 |
| Median | 0.660865 |
| Decile 4 | 0.653439 |
| Decile 3 | 0.645116 |
| Decile 2 | 0.634871 |
| Decile 1 | 0.619757 |
| Minimum | 0.516251 |
|
|
- Mean = 0.660543
- Std.dev = 0.0326753
- 4 items below graph minimum of 0.539257
- 2 items above graph maximum of 0.780759
|
Notes
Mean ICVF (intra-cellular volume fraction) in body of corpus callosum on FA (fractional anisotropy) skeleton (from dMRI data)
0 Related Data-Fields
There are no related data-fields
2 Applications
| Application ID | Title |
|---|
| 17689 | Genetic, environmental and lifestyle predictors of brain/cognitive-related outcomes. |
| 22783 | The joint analysis of imaging data and genetic data for early tumor detection, prevention, diagnosis and treatment |

