Data
83,906 items of data are available, covering 79,379 participants.
Defined-instances run from 2 to 3, labelled using Instancing
2.
Units of measurement are AU.
| Maximum | 0.99 |
| Decile 9 | 0.773991 |
| Decile 8 | 0.759458 |
| Decile 7 | 0.749095 |
| Decile 6 | 0.740623 |
| Median | 0.732676 |
| Decile 4 | 0.724832 |
| Decile 3 | 0.716494 |
| Decile 2 | 0.706875 |
| Decile 1 | 0.693654 |
| Minimum | 0 |
|
|
- Mean = 0.733426
- Std.dev = 0.0324491
- 22 items below graph minimum of 0.613317
- 74 items above graph maximum of 0.854327
|
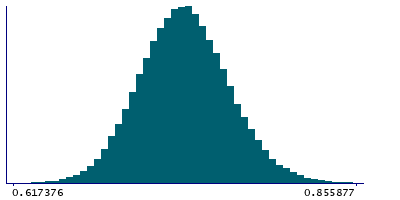
2 Instances
Instance 2 : Imaging visit (2014+)
79,148 participants, 79,148 items
| Maximum | 0.99 |
| Decile 9 | 0.773764 |
| Decile 8 | 0.759235 |
| Decile 7 | 0.748856 |
| Decile 6 | 0.740331 |
| Median | 0.732421 |
| Decile 4 | 0.72459 |
| Decile 3 | 0.716228 |
| Decile 2 | 0.706573 |
| Decile 1 | 0.693393 |
| Minimum | 0 |
|

|
- Mean = 0.73318
- Std.dev = 0.0324986
- 20 items below graph minimum of 0.613021
- 70 items above graph maximum of 0.854136
|
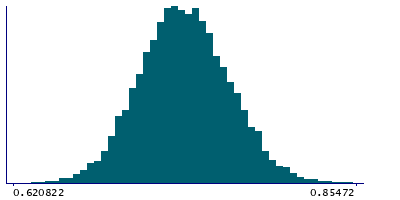
Instance 3 : First repeat imaging visit (2019+)
4,758 participants, 4,758 items
| Maximum | 0.989997 |
| Decile 9 | 0.776775 |
| Decile 8 | 0.763205 |
| Decile 7 | 0.75288 |
| Decile 6 | 0.744635 |
| Median | 0.736673 |
| Decile 4 | 0.729056 |
| Decile 3 | 0.721036 |
| Decile 2 | 0.711799 |
| Decile 1 | 0.698787 |
| Minimum | 0.596337 |
|
|
- Mean = 0.73752
- Std.dev = 0.0313318
- 2 items below graph minimum of 0.620799
- 4 items above graph maximum of 0.854763
|
Notes
Mean ICVF (intra-cellular volume fraction) in cerebral peduncle (right) on FA (fractional anisotropy) skeleton (from dMRI data)
0 Related Data-Fields
There are no related data-fields
2 Applications
| Application ID | Title |
|---|
| 17689 | Genetic, environmental and lifestyle predictors of brain/cognitive-related outcomes. |
| 22783 | The joint analysis of imaging data and genetic data for early tumor detection, prevention, diagnosis and treatment |

