Data
83,906 items of data are available, covering 79,379 participants.
Defined-instances run from 2 to 3, labelled using Instancing
2.
Units of measurement are AU.
| Maximum | 0.99 |
| Decile 9 | 0.63127 |
| Decile 8 | 0.615229 |
| Decile 7 | 0.603681 |
| Decile 6 | 0.593714 |
| Median | 0.584541 |
| Decile 4 | 0.575016 |
| Decile 3 | 0.565038 |
| Decile 2 | 0.553249 |
| Decile 1 | 0.536185 |
| Minimum | 0.383719 |
|

|
- Mean = 0.584131
- Std.dev = 0.0379959
- 22 items below graph minimum of 0.441099
- 44 items above graph maximum of 0.726355
|
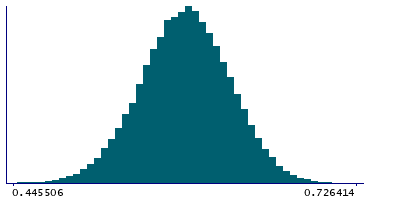
2 Instances
Instance 2 : Imaging visit (2014+)
79,148 participants, 79,148 items
| Maximum | 0.99 |
| Decile 9 | 0.63115 |
| Decile 8 | 0.61504 |
| Decile 7 | 0.603442 |
| Decile 6 | 0.593472 |
| Median | 0.584276 |
| Decile 4 | 0.574715 |
| Decile 3 | 0.564688 |
| Decile 2 | 0.552948 |
| Decile 1 | 0.535834 |
| Minimum | 0.383719 |
|
|
- Mean = 0.583858
- Std.dev = 0.0380626
- 19 items below graph minimum of 0.440519
- 41 items above graph maximum of 0.726465
|
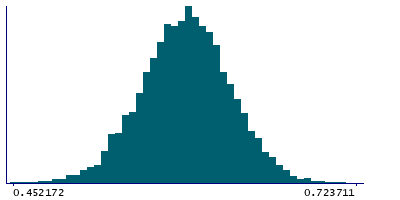
Instance 3 : First repeat imaging visit (2019+)
4,758 participants, 4,758 items
| Maximum | 0.981876 |
| Decile 9 | 0.633187 |
| Decile 8 | 0.617293 |
| Decile 7 | 0.606963 |
| Decile 6 | 0.597417 |
| Median | 0.589215 |
| Decile 4 | 0.580062 |
| Decile 3 | 0.57069 |
| Decile 2 | 0.559468 |
| Decile 1 | 0.542662 |
| Minimum | 0.440689 |
|
|
- Mean = 0.588672
- Std.dev = 0.0365724
- 1 item below graph minimum of 0.452137
- 3 items above graph maximum of 0.723712
|
Notes
Mean ICVF (intra-cellular volume fraction) in cingulum cingulate gyrus (right) on FA (fractional anisotropy) skeleton (from dMRI data)
0 Related Data-Fields
There are no related data-fields
2 Applications
| Application ID | Title |
|---|
| 17689 | Genetic, environmental and lifestyle predictors of brain/cognitive-related outcomes. |
| 22783 | The joint analysis of imaging data and genetic data for early tumor detection, prevention, diagnosis and treatment |

