Data
83,906 items of data are available, covering 79,379 participants.
Defined-instances run from 2 to 3, labelled using Instancing
2.
Units of measurement are AU.
| Maximum | 0.99 |
| Decile 9 | 0.537092 |
| Decile 8 | 0.522361 |
| Decile 7 | 0.51215 |
| Decile 6 | 0.503731 |
| Median | 0.495937 |
| Decile 4 | 0.488237 |
| Decile 3 | 0.480159 |
| Decile 2 | 0.470653 |
| Decile 1 | 0.457854 |
| Minimum | 0 |
|
|
- Mean = 0.496924
- Std.dev = 0.0329146
- 28 items below graph minimum of 0.378615
- 74 items above graph maximum of 0.616331
|
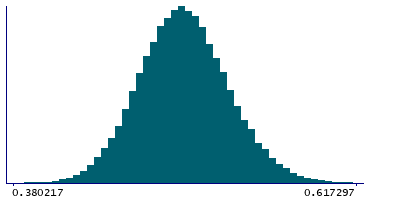
2 Instances
Instance 2 : Imaging visit (2014+)
79,148 participants, 79,148 items
| Maximum | 0.99 |
| Decile 9 | 0.536814 |
| Decile 8 | 0.522092 |
| Decile 7 | 0.511886 |
| Decile 6 | 0.503447 |
| Median | 0.495663 |
| Decile 4 | 0.487975 |
| Decile 3 | 0.479851 |
| Decile 2 | 0.470366 |
| Decile 1 | 0.457577 |
| Minimum | 0 |
|
|
- Mean = 0.496637
- Std.dev = 0.0329076
- 27 items below graph minimum of 0.37834
- 71 items above graph maximum of 0.616051
|
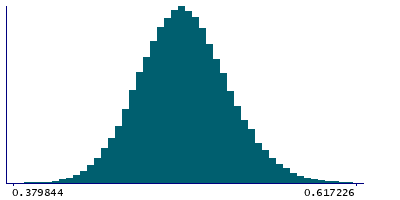
Instance 3 : First repeat imaging visit (2019+)
4,758 participants, 4,758 items
| Maximum | 0.970024 |
| Decile 9 | 0.541067 |
| Decile 8 | 0.526655 |
| Decile 7 | 0.516632 |
| Decile 6 | 0.508425 |
| Median | 0.500528 |
| Decile 4 | 0.492926 |
| Decile 3 | 0.484997 |
| Decile 2 | 0.476104 |
| Decile 1 | 0.463438 |
| Minimum | 0.330901 |
|

|
- Mean = 0.5017
- Std.dev = 0.0326624
- 1 item below graph minimum of 0.385808
- 4 items above graph maximum of 0.618696
|
Notes
Mean ICVF (intra-cellular volume fraction) in cingulum hippocampus (right) on FA (fractional anisotropy) skeleton (from dMRI data)
0 Related Data-Fields
There are no related data-fields
2 Applications
| Application ID | Title |
|---|
| 17689 | Genetic, environmental and lifestyle predictors of brain/cognitive-related outcomes. |
| 22783 | The joint analysis of imaging data and genetic data for early tumor detection, prevention, diagnosis and treatment |

