Data
83,906 items of data are available, covering 79,379 participants.
Defined-instances run from 2 to 3, labelled using Instancing
2.
Units of measurement are AU.
| Maximum | 0.99 |
| Decile 9 | 0.612396 |
| Decile 8 | 0.59684 |
| Decile 7 | 0.585934 |
| Decile 6 | 0.576492 |
| Median | 0.568012 |
| Decile 4 | 0.559459 |
| Decile 3 | 0.550264 |
| Decile 2 | 0.539521 |
| Decile 1 | 0.524487 |
| Minimum | 0 |
|

|
- Mean = 0.568309
- Std.dev = 0.035977
- 51 items below graph minimum of 0.436579
- 71 items above graph maximum of 0.700304
|
2 Instances
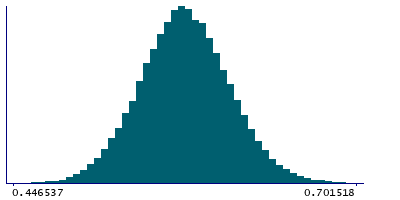
Instance 2 : Imaging visit (2014+)
79,148 participants, 79,148 items
| Maximum | 0.99 |
| Decile 9 | 0.611891 |
| Decile 8 | 0.596303 |
| Decile 7 | 0.585398 |
| Decile 6 | 0.575951 |
| Median | 0.567499 |
| Decile 4 | 0.558927 |
| Decile 3 | 0.549753 |
| Decile 2 | 0.539068 |
| Decile 1 | 0.523902 |
| Minimum | 0 |
|
|
- Mean = 0.567768
- Std.dev = 0.0359738
- 47 items below graph minimum of 0.435913
- 70 items above graph maximum of 0.699879
|
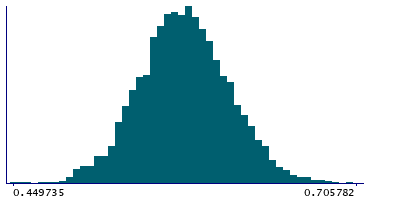
Instance 3 : First repeat imaging visit (2019+)
4,758 participants, 4,758 items
| Maximum | 0.967211 |
| Decile 9 | 0.620469 |
| Decile 8 | 0.605021 |
| Decile 7 | 0.59404 |
| Decile 6 | 0.584913 |
| Median | 0.576674 |
| Decile 4 | 0.568124 |
| Decile 3 | 0.559598 |
| Decile 2 | 0.549531 |
| Decile 1 | 0.535034 |
| Minimum | 0.416784 |
|
|
- Mean = 0.577298
- Std.dev = 0.0348222
- 2 items below graph minimum of 0.449599
- 3 items above graph maximum of 0.705904
|
Notes
Mean ICVF (intra-cellular volume fraction) in fornix cres+stria terminalis (right) on FA (fractional anisotropy) skeleton (from dMRI data)
0 Related Data-Fields
There are no related data-fields
2 Applications
| Application ID | Title |
|---|
| 17689 | Genetic, environmental and lifestyle predictors of brain/cognitive-related outcomes. |
| 22783 | The joint analysis of imaging data and genetic data for early tumor detection, prevention, diagnosis and treatment |

