Data
83,906 items of data are available, covering 79,379 participants.
Defined-instances run from 2 to 3, labelled using Instancing
2.
Units of measurement are AU.
| Maximum | 0.703308 |
| Decile 9 | 0.206085 |
| Decile 8 | 0.198735 |
| Decile 7 | 0.193285 |
| Decile 6 | 0.188448 |
| Median | 0.183669 |
| Decile 4 | 0.178741 |
| Decile 3 | 0.173104 |
| Decile 2 | 0.165936 |
| Decile 1 | 0.155324 |
| Minimum | 0.079652 |
|
|
- Mean = 0.182189
- Std.dev = 0.0203902
- 30 items below graph minimum of 0.104564
- 27 items above graph maximum of 0.256845
|
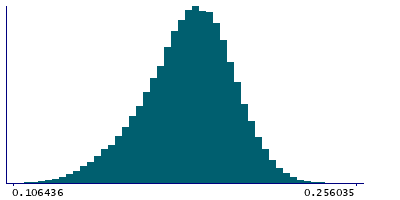
2 Instances
Instance 2 : Imaging visit (2014+)
79,148 participants, 79,148 items
| Maximum | 0.703308 |
| Decile 9 | 0.206107 |
| Decile 8 | 0.19875 |
| Decile 7 | 0.193283 |
| Decile 6 | 0.188435 |
| Median | 0.183641 |
| Decile 4 | 0.178694 |
| Decile 3 | 0.173038 |
| Decile 2 | 0.165842 |
| Decile 1 | 0.155216 |
| Minimum | 0.079652 |
|

|
- Mean = 0.182147
- Std.dev = 0.0203987
- 27 items below graph minimum of 0.104324
- 24 items above graph maximum of 0.256999
|
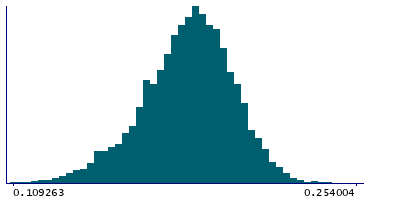
Instance 3 : First repeat imaging visit (2019+)
4,758 participants, 4,758 items
| Maximum | 0.538774 |
| Decile 9 | 0.205778 |
| Decile 8 | 0.198454 |
| Decile 7 | 0.193399 |
| Decile 6 | 0.188693 |
| Median | 0.184321 |
| Decile 4 | 0.179501 |
| Decile 3 | 0.174329 |
| Decile 2 | 0.167268 |
| Decile 1 | 0.157502 |
| Minimum | 0.097031 |
|
|
- Mean = 0.182896
- Std.dev = 0.0202367
- 2 items below graph minimum of 0.109227
- 3 items above graph maximum of 0.254053
|
Notes
Mean OD (orientation dispersion index) in superior corona radiata (left) on FA (fractional anisotropy) skeleton (from dMRI data)
0 Related Data-Fields
There are no related data-fields
2 Applications
| Application ID | Title |
|---|
| 17689 | Genetic, environmental and lifestyle predictors of brain/cognitive-related outcomes. |
| 22783 | The joint analysis of imaging data and genetic data for early tumor detection, prevention, diagnosis and treatment |

