Data
83,906 items of data are available, covering 79,379 participants.
Defined-instances run from 2 to 3, labelled using Instancing
2.
Units of measurement are AU.
| Maximum | 0.682664 |
| Decile 9 | 0.158979 |
| Decile 8 | 0.151137 |
| Decile 7 | 0.14529 |
| Decile 6 | 0.140342 |
| Median | 0.135704 |
| Decile 4 | 0.13111 |
| Decile 3 | 0.126202 |
| Decile 2 | 0.120687 |
| Decile 1 | 0.113352 |
| Minimum | 0.065069 |
|

|
- Mean = 0.135997
- Std.dev = 0.0186204
- 3 items below graph minimum of 0.0677245
- 52 items above graph maximum of 0.204607
|
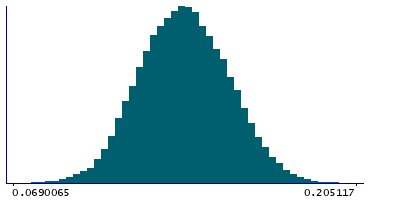
2 Instances
Instance 2 : Imaging visit (2014+)
79,148 participants, 79,148 items
| Maximum | 0.682664 |
| Decile 9 | 0.158905 |
| Decile 8 | 0.151052 |
| Decile 7 | 0.145146 |
| Decile 6 | 0.140191 |
| Median | 0.135569 |
| Decile 4 | 0.130942 |
| Decile 3 | 0.126039 |
| Decile 2 | 0.120529 |
| Decile 1 | 0.113237 |
| Minimum | 0.065069 |
|
|
- Mean = 0.135855
- Std.dev = 0.0185546
- 3 items below graph minimum of 0.0675685
- 49 items above graph maximum of 0.204574
|
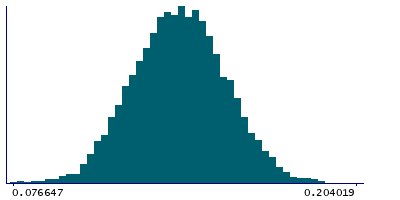
Instance 3 : First repeat imaging visit (2019+)
4,758 participants, 4,758 items
| Maximum | 0.679545 |
| Decile 9 | 0.160099 |
| Decile 8 | 0.152641 |
| Decile 7 | 0.147217 |
| Decile 6 | 0.142773 |
| Median | 0.138307 |
| Decile 4 | 0.133833 |
| Decile 3 | 0.129202 |
| Decile 2 | 0.12355 |
| Decile 1 | 0.11616 |
| Minimum | 0.076647 |
|
|
- Mean = 0.138365
- Std.dev = 0.0195314
- 3 items above graph maximum of 0.204037
|
Notes
Mean OD (orientation dispersion index) in posterior corona radiata (right) on FA (fractional anisotropy) skeleton (from dMRI data)
0 Related Data-Fields
There are no related data-fields
2 Applications
| Application ID | Title |
|---|
| 17689 | Genetic, environmental and lifestyle predictors of brain/cognitive-related outcomes. |
| 22783 | The joint analysis of imaging data and genetic data for early tumor detection, prevention, diagnosis and treatment |

