Data
83,906 items of data are available, covering 79,379 participants.
Defined-instances run from 2 to 3, labelled using Instancing
2.
Units of measurement are AU.
| Maximum | 0.652346 |
| Decile 9 | 0.091476 |
| Decile 8 | 0.0846565 |
| Decile 7 | 0.0807275 |
| Decile 6 | 0.077763 |
| Median | 0.075259 |
| Decile 4 | 0.072935 |
| Decile 3 | 0.070626 |
| Decile 2 | 0.06814 |
| Decile 1 | 0.064956 |
| Minimum | 0 |
|
|
- Mean = 0.077283
- Std.dev = 0.0125553
- 2 items below graph minimum of 0.038436
- 811 items above graph maximum of 0.117996
|
2 Instances
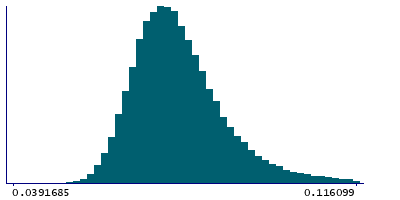
Instance 2 : Imaging visit (2014+)
79,148 participants, 79,148 items
| Maximum | 0.652346 |
| Decile 9 | 0.09154 |
| Decile 8 | 0.0846885 |
| Decile 7 | 0.080738 |
| Decile 6 | 0.077768 |
| Median | 0.075244 |
| Decile 4 | 0.072911 |
| Decile 3 | 0.0706 |
| Decile 2 | 0.068109 |
| Decile 1 | 0.064929 |
| Minimum | 0 |
|

|
- Mean = 0.0772895
- Std.dev = 0.0125559
- 2 items below graph minimum of 0.038318
- 773 items above graph maximum of 0.118151
|
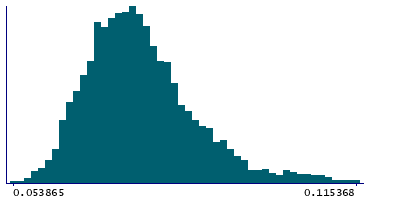
Instance 3 : First repeat imaging visit (2019+)
4,758 participants, 4,758 items
| Maximum | 0.524286 |
| Decile 9 | 0.090414 |
| Decile 8 | 0.0841295 |
| Decile 7 | 0.080503 |
| Decile 6 | 0.0777015 |
| Median | 0.075449 |
| Decile 4 | 0.0733365 |
| Decile 3 | 0.071058 |
| Decile 2 | 0.06868 |
| Decile 1 | 0.065432 |
| Minimum | 0.053865 |
|
|
- Mean = 0.0771754
- Std.dev = 0.0125446
- 37 items above graph maximum of 0.115396
|
Notes
Mean OD (orientation dispersion index) in posterior thalamic radiation (left) on FA (fractional anisotropy) skeleton (from dMRI data)
0 Related Data-Fields
There are no related data-fields
2 Applications
| Application ID | Title |
|---|
| 17689 | Genetic, environmental and lifestyle predictors of brain/cognitive-related outcomes. |
| 22783 | The joint analysis of imaging data and genetic data for early tumor detection, prevention, diagnosis and treatment |

