Data
83,906 items of data are available, covering 79,379 participants.
Defined-instances run from 2 to 3, labelled using Instancing
2.
Units of measurement are AU.
| Maximum | 0.561188 |
| Decile 9 | 0.191701 |
| Decile 8 | 0.184644 |
| Decile 7 | 0.17969 |
| Decile 6 | 0.175531 |
| Median | 0.171763 |
| Decile 4 | 0.168029 |
| Decile 3 | 0.164097 |
| Decile 2 | 0.15961 |
| Decile 1 | 0.15357 |
| Minimum | 0 |
|

|
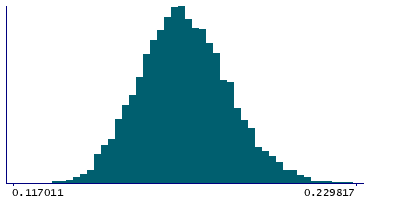
- Mean = 0.172442
- Std.dev = 0.0164762
- 3 items below graph minimum of 0.115438
- 136 items above graph maximum of 0.229832
|
2 Instances
Instance 2 : Imaging visit (2014+)
79,148 participants, 79,148 items
| Maximum | 0.561188 |
| Decile 9 | 0.191684 |
| Decile 8 | 0.184602 |
| Decile 7 | 0.179638 |
| Decile 6 | 0.175482 |
| Median | 0.171714 |
| Decile 4 | 0.167978 |
| Decile 3 | 0.164021 |
| Decile 2 | 0.159554 |
| Decile 1 | 0.15351 |
| Minimum | 0 |
|

|
- Mean = 0.172384
- Std.dev = 0.0164656
- 3 items below graph minimum of 0.115337
- 131 items above graph maximum of 0.229858
|
Instance 3 : First repeat imaging visit (2019+)
4,758 participants, 4,758 items
| Maximum | 0.531488 |
| Decile 9 | 0.19225 |
| Decile 8 | 0.185273 |
| Decile 7 | 0.18051 |
| Decile 6 | 0.176403 |
| Median | 0.172599 |
| Decile 4 | 0.169125 |
| Decile 3 | 0.165267 |
| Decile 2 | 0.160826 |
| Decile 1 | 0.15461 |
| Minimum | 0.115648 |
|
|
- Mean = 0.173396
- Std.dev = 0.0166211
- 1 item below graph minimum of 0.11697
- 4 items above graph maximum of 0.22989
|
Notes
Mean OD (orientation dispersion index) in external capsule (left) on FA (fractional anisotropy) skeleton (from dMRI data)
0 Related Data-Fields
There are no related data-fields
2 Applications
| Application ID | Title |
|---|
| 17689 | Genetic, environmental and lifestyle predictors of brain/cognitive-related outcomes. |
| 22783 | The joint analysis of imaging data and genetic data for early tumor detection, prevention, diagnosis and treatment |

