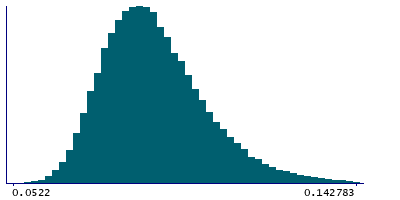
Data
83,906 items of data are available, covering 79,379 participants.
Defined-instances run from 2 to 3, labelled using Instancing
2.
Units of measurement are AU.
| Maximum | 0.593547 |
| Decile 9 | 0.108993 |
| Decile 8 | 0.100821 |
| Decile 7 | 0.0957075 |
| Decile 6 | 0.091683 |
| Median | 0.088266 |
| Decile 4 | 0.085036 |
| Decile 3 | 0.081786 |
| Decile 2 | 0.07831 |
| Decile 1 | 0.0738865 |
| Minimum | 0.05214 |
|
|
- Mean = 0.0904554
- Std.dev = 0.0168084
- 470 items above graph maximum of 0.144099
|
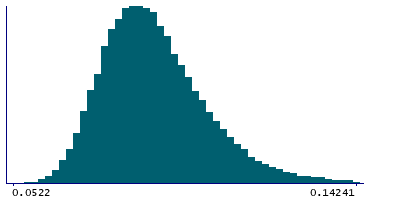
2 Instances
Instance 2 : Imaging visit (2014+)
79,148 participants, 79,148 items
| Maximum | 0.593547 |
| Decile 9 | 0.109074 |
| Decile 8 | 0.10091 |
| Decile 7 | 0.095792 |
| Decile 6 | 0.091754 |
| Median | 0.088324 |
| Decile 4 | 0.085095 |
| Decile 3 | 0.08184 |
| Decile 2 | 0.0783565 |
| Decile 1 | 0.073907 |
| Minimum | 0.05214 |
|
|
- Mean = 0.0905235
- Std.dev = 0.0167514
- 446 items above graph maximum of 0.14424
|
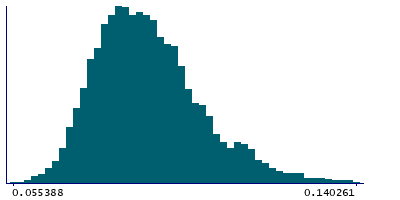
Instance 3 : First repeat imaging visit (2019+)
4,758 participants, 4,758 items
| Maximum | 0.539095 |
| Decile 9 | 0.106916 |
| Decile 8 | 0.098996 |
| Decile 7 | 0.0944285 |
| Decile 6 | 0.090475 |
| Median | 0.087267 |
| Decile 4 | 0.0840215 |
| Decile 3 | 0.080938 |
| Decile 2 | 0.077656 |
| Decile 1 | 0.0735635 |
| Minimum | 0.055388 |
|
|
- Mean = 0.089323
- Std.dev = 0.0176915
- 24 items above graph maximum of 0.140269
|
Notes
Mean OD (orientation dispersion index) in cingulum cingulate gyrus (right) on FA (fractional anisotropy) skeleton (from dMRI data)
0 Related Data-Fields
There are no related data-fields
2 Applications
| Application ID | Title |
|---|
| 17689 | Genetic, environmental and lifestyle predictors of brain/cognitive-related outcomes. |
| 22783 | The joint analysis of imaging data and genetic data for early tumor detection, prevention, diagnosis and treatment |

