Data
83,906 items of data are available, covering 79,379 participants.
Defined-instances run from 2 to 3, labelled using Instancing
2.
Units of measurement are AU.
| Maximum | 0.616663 |
| Decile 9 | 0.149678 |
| Decile 8 | 0.138101 |
| Decile 7 | 0.129947 |
| Decile 6 | 0.123477 |
| Median | 0.11767 |
| Decile 4 | 0.112165 |
| Decile 3 | 0.106531 |
| Decile 2 | 0.100418 |
| Decile 1 | 0.092678 |
| Minimum | 0 |
|
|
- Mean = 0.119865
- Std.dev = 0.0231507
- 132 items above graph maximum of 0.206678
|
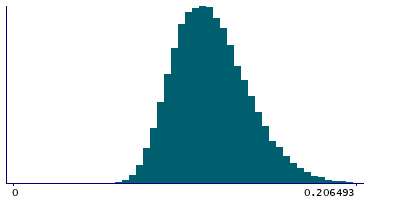
2 Instances
Instance 2 : Imaging visit (2014+)
79,148 participants, 79,148 items
| Maximum | 0.616663 |
| Decile 9 | 0.149541 |
| Decile 8 | 0.13793 |
| Decile 7 | 0.129771 |
| Decile 6 | 0.123296 |
| Median | 0.11748 |
| Decile 4 | 0.111993 |
| Decile 3 | 0.106388 |
| Decile 2 | 0.100301 |
| Decile 1 | 0.0925685 |
| Minimum | 0 |
|

|
- Mean = 0.119714
- Std.dev = 0.0230833
- 125 items above graph maximum of 0.206514
|
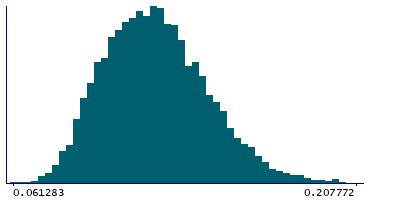
Instance 3 : First repeat imaging visit (2019+)
4,758 participants, 4,758 items
| Maximum | 0.602224 |
| Decile 9 | 0.151316 |
| Decile 8 | 0.140352 |
| Decile 7 | 0.132518 |
| Decile 6 | 0.126213 |
| Median | 0.120826 |
| Decile 4 | 0.114947 |
| Decile 3 | 0.109103 |
| Decile 2 | 0.102739 |
| Decile 1 | 0.0948375 |
| Minimum | 0.061283 |
|
|
- Mean = 0.122376
- Std.dev = 0.0241063
- 8 items above graph maximum of 0.207795
|
Notes
Mean OD (orientation dispersion index) in uncinate fasciculus (right) on FA (fractional anisotropy) skeleton (from dMRI data)
0 Related Data-Fields
There are no related data-fields
2 Applications
| Application ID | Title |
|---|
| 17689 | Genetic, environmental and lifestyle predictors of brain/cognitive-related outcomes. |
| 22783 | The joint analysis of imaging data and genetic data for early tumor detection, prevention, diagnosis and treatment |

