Data
83,909 items of data are available, covering 79,382 participants.
Defined-instances run from 2 to 3, labelled using Instancing
2.
Units of measurement are AU.
| Maximum | 0.48208 |
| Decile 9 | 0.412749 |
| Decile 8 | 0.402576 |
| Decile 7 | 0.395311 |
| Decile 6 | 0.388999 |
| Median | 0.383074 |
| Decile 4 | 0.377016 |
| Decile 3 | 0.370476 |
| Decile 2 | 0.362796 |
| Decile 1 | 0.351838 |
| Minimum | 0 |
|

|
- Mean = 0.382499
- Std.dev = 0.0244298
- 69 items below graph minimum of 0.290927
- 6 items above graph maximum of 0.47366
|
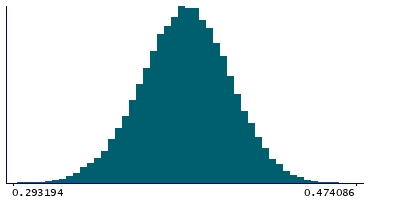
2 Instances
Instance 2 : Imaging visit (2014+)
79,151 participants, 79,151 items
| Maximum | 0.48208 |
| Decile 9 | 0.412819 |
| Decile 8 | 0.402601 |
| Decile 7 | 0.395293 |
| Decile 6 | 0.388956 |
| Median | 0.383003 |
| Decile 4 | 0.37693 |
| Decile 3 | 0.37038 |
| Decile 2 | 0.36268 |
| Decile 1 | 0.351686 |
| Minimum | 0 |
|
|
- Mean = 0.38244
- Std.dev = 0.0245129
- 65 items below graph minimum of 0.290553
- 6 items above graph maximum of 0.473952
|
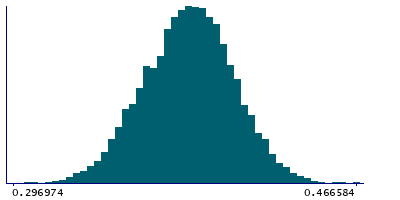
Instance 3 : First repeat imaging visit (2019+)
4,758 participants, 4,758 items
| Maximum | 0.466584 |
| Decile 9 | 0.411565 |
| Decile 8 | 0.402081 |
| Decile 7 | 0.395524 |
| Decile 6 | 0.389799 |
| Median | 0.384109 |
| Decile 4 | 0.378568 |
| Decile 3 | 0.372471 |
| Decile 2 | 0.364416 |
| Decile 1 | 0.354248 |
| Minimum | 0 |
|
|
- Mean = 0.383474
- Std.dev = 0.022982
- 3 items below graph minimum of 0.296932
|
Notes
Weighted-mean FA (fractional anisotropy) in tract left uncinate fasciculus (from dMRI data)
0 Related Data-Fields
There are no related data-fields
2 Applications
| Application ID | Title |
|---|
| 17689 | Genetic, environmental and lifestyle predictors of brain/cognitive-related outcomes. |
| 22783 | The joint analysis of imaging data and genetic data for early tumor detection, prevention, diagnosis and treatment |

