Data
83,909 items of data are available, covering 79,382 participants.
Defined-instances run from 2 to 3, labelled using Instancing
2.
Units of measurement are AU.
| Maximum | 0.00135169 |
| Decile 9 | 0.000837218 |
| Decile 8 | 0.000818878 |
| Decile 7 | 0.000806659 |
| Decile 6 | 0.000796879 |
| Median | 0.000787975 |
| Decile 4 | 0.000779405 |
| Decile 3 | 0.00077047 |
| Decile 2 | 0.000760316 |
| Decile 1 | 0.000746503 |
| Minimum | 0 |
|

|
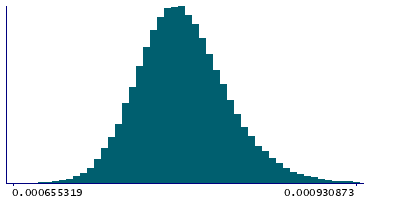
- Mean = 0.000790326
- Std.dev = 4.00767e-05
- 32 items below graph minimum of 0.000655789
- 227 items above graph maximum of 0.000927932
|
2 Instances
Instance 2 : Imaging visit (2014+)
79,151 participants, 79,151 items
| Maximum | 0.00135169 |
| Decile 9 | 0.000837541 |
| Decile 8 | 0.000819149 |
| Decile 7 | 0.000806871 |
| Decile 6 | 0.000797052 |
| Median | 0.000788124 |
| Decile 4 | 0.000779526 |
| Decile 3 | 0.000770627 |
| Decile 2 | 0.000760454 |
| Decile 1 | 0.000746597 |
| Minimum | 0 |
|
|
- Mean = 0.00079055
- Std.dev = 4.00702e-05
- 29 items below graph minimum of 0.000655654
- 220 items above graph maximum of 0.000928484
|
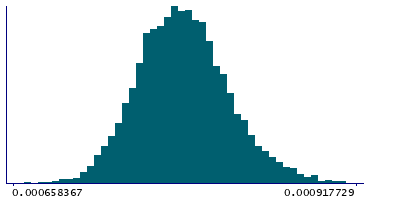
Instance 3 : First repeat imaging visit (2019+)
4,758 participants, 4,758 items
| Maximum | 0.00108115 |
| Decile 9 | 0.00083129 |
| Decile 8 | 0.000814741 |
| Decile 7 | 0.000803102 |
| Decile 6 | 0.000794065 |
| Median | 0.000785311 |
| Decile 4 | 0.000776895 |
| Decile 3 | 0.00076781 |
| Decile 2 | 0.000758158 |
| Decile 1 | 0.000744821 |
| Minimum | 0 |
|
|
- Mean = 0.0007866
- Std.dev = 4.00022e-05
- 3 items below graph minimum of 0.000658351
- 8 items above graph maximum of 0.000917759
|
Notes
Weighted-mean MD (mean diffusivity) in tract right acoustic radiation (from dMRI data)
0 Related Data-Fields
There are no related data-fields
2 Applications
| Application ID | Title |
|---|
| 17689 | Genetic, environmental and lifestyle predictors of brain/cognitive-related outcomes. |
| 22783 | The joint analysis of imaging data and genetic data for early tumor detection, prevention, diagnosis and treatment |

