Data
83,909 items of data are available, covering 79,382 participants.
Defined-instances run from 2 to 3, labelled using Instancing
2.
Units of measurement are AU.
| Maximum | 0.587978 |
| Decile 9 | 0.46389 |
| Decile 8 | 0.445769 |
| Decile 7 | 0.432297 |
| Decile 6 | 0.420914 |
| Median | 0.409846 |
| Decile 4 | 0.398566 |
| Decile 3 | 0.386414 |
| Decile 2 | 0.372384 |
| Decile 1 | 0.352186 |
| Minimum | -0.0305171 |
|

|
- Mean = 0.408638
- Std.dev = 0.0441886
- 45 items below graph minimum of 0.240481
- 2 items above graph maximum of 0.575594
|
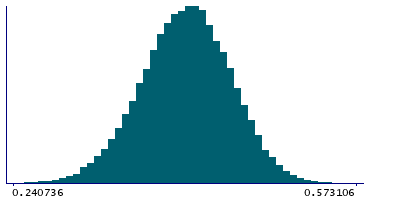
2 Instances
Instance 2 : Imaging visit (2014+)
79,151 participants, 79,151 items
| Maximum | 0.587978 |
| Decile 9 | 0.464057 |
| Decile 8 | 0.445898 |
| Decile 7 | 0.432379 |
| Decile 6 | 0.420985 |
| Median | 0.409948 |
| Decile 4 | 0.398689 |
| Decile 3 | 0.386557 |
| Decile 2 | 0.372601 |
| Decile 1 | 0.352289 |
| Minimum | -0.00355401 |
|
|
- Mean = 0.408768
- Std.dev = 0.044159
- 40 items below graph minimum of 0.24052
- 2 items above graph maximum of 0.575826
|
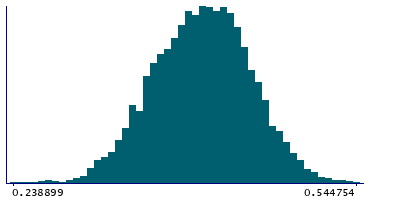
Instance 3 : First repeat imaging visit (2019+)
4,758 participants, 4,758 items
| Maximum | 0.544754 |
| Decile 9 | 0.461109 |
| Decile 8 | 0.443237 |
| Decile 7 | 0.431029 |
| Decile 6 | 0.419646 |
| Median | 0.408096 |
| Decile 4 | 0.396049 |
| Decile 3 | 0.383606 |
| Decile 2 | 0.369121 |
| Decile 1 | 0.349992 |
| Minimum | -0.0305171 |
|
|
- Mean = 0.406469
- Std.dev = 0.0446226
- 4 items below graph minimum of 0.238876
|
Notes
Weighted-mean MO (diffusion tensor mode) in tract left anterior thalamic radiation (from dMRI data)
0 Related Data-Fields
There are no related data-fields
2 Applications
| Application ID | Title |
|---|
| 17689 | Genetic, environmental and lifestyle predictors of brain/cognitive-related outcomes. |
| 22783 | The joint analysis of imaging data and genetic data for early tumor detection, prevention, diagnosis and treatment |

