Data
83,909 items of data are available, covering 79,382 participants.
Defined-instances run from 2 to 3, labelled using Instancing
2.
Units of measurement are AU.
| Maximum | 0.827069 |
| Decile 9 | 0.767077 |
| Decile 8 | 0.75586 |
| Decile 7 | 0.747303 |
| Decile 6 | 0.739624 |
| Median | 0.732091 |
| Decile 4 | 0.724175 |
| Decile 3 | 0.715031 |
| Decile 2 | 0.70322 |
| Decile 1 | 0.684494 |
| Minimum | 0 |
|
|
- Mean = 0.727822
- Std.dev = 0.0362032
- 410 items below graph minimum of 0.601912
|
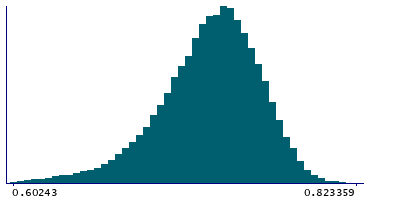
2 Instances
Instance 2 : Imaging visit (2014+)
79,151 participants, 79,151 items
| Maximum | 0.827069 |
| Decile 9 | 0.767195 |
| Decile 8 | 0.755963 |
| Decile 7 | 0.747407 |
| Decile 6 | 0.739711 |
| Median | 0.732147 |
| Decile 4 | 0.724211 |
| Decile 3 | 0.715094 |
| Decile 2 | 0.703264 |
| Decile 1 | 0.684614 |
| Minimum | 0 |
|

|
- Mean = 0.727913
- Std.dev = 0.0362248
- 391 items below graph minimum of 0.602033
|
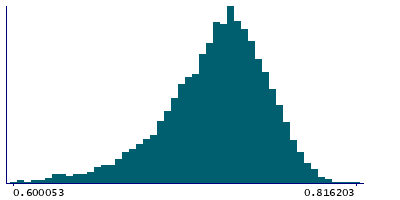
Instance 3 : First repeat imaging visit (2019+)
4,758 participants, 4,758 items
| Maximum | 0.816203 |
| Decile 9 | 0.764966 |
| Decile 8 | 0.753852 |
| Decile 7 | 0.745653 |
| Decile 6 | 0.738239 |
| Median | 0.731082 |
| Decile 4 | 0.723408 |
| Decile 3 | 0.713837 |
| Decile 2 | 0.702444 |
| Decile 1 | 0.682497 |
| Minimum | 0 |
|
|
- Mean = 0.72632
- Std.dev = 0.0358091
- 19 items below graph minimum of 0.600028
|
Notes
Weighted-mean MO (diffusion tensor mode) in tract forceps major (from dMRI data)
0 Related Data-Fields
There are no related data-fields
2 Applications
| Application ID | Title |
|---|
| 17689 | Genetic, environmental and lifestyle predictors of brain/cognitive-related outcomes. |
| 22783 | The joint analysis of imaging data and genetic data for early tumor detection, prevention, diagnosis and treatment |

