Data
83,909 items of data are available, covering 79,382 participants.
Defined-instances run from 2 to 3, labelled using Instancing
2.
Units of measurement are AU.
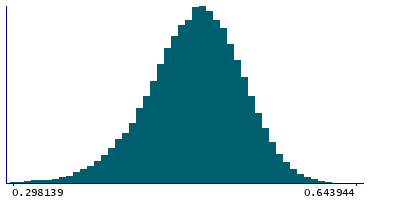
| Maximum | 0.650922 |
| Decile 9 | 0.538281 |
| Decile 8 | 0.519931 |
| Decile 7 | 0.506079 |
| Decile 6 | 0.493726 |
| Median | 0.482187 |
| Decile 4 | 0.470182 |
| Decile 3 | 0.456997 |
| Decile 2 | 0.44083 |
| Decile 1 | 0.416089 |
| Minimum | 0 |
|
|
- Mean = 0.478984
- Std.dev = 0.0494353
- 167 items below graph minimum of 0.293897
|
2 Instances
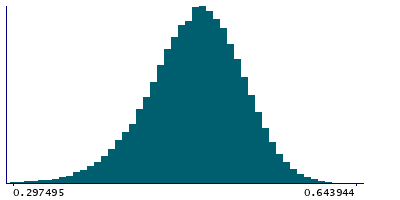
Instance 2 : Imaging visit (2014+)
79,151 participants, 79,151 items
| Maximum | 0.650922 |
| Decile 9 | 0.538346 |
| Decile 8 | 0.520002 |
| Decile 7 | 0.506108 |
| Decile 6 | 0.493689 |
| Median | 0.48217 |
| Decile 4 | 0.470155 |
| Decile 3 | 0.456909 |
| Decile 2 | 0.44071 |
| Decile 1 | 0.415825 |
| Minimum | 0 |
|
|
- Mean = 0.478942
- Std.dev = 0.0495499
- 155 items below graph minimum of 0.293304
|
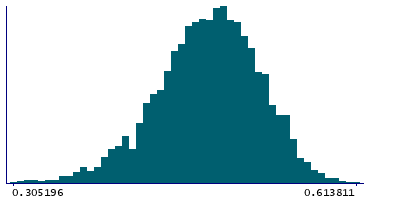
Instance 3 : First repeat imaging visit (2019+)
4,758 participants, 4,758 items
| Maximum | 0.613811 |
| Decile 9 | 0.536667 |
| Decile 8 | 0.519043 |
| Decile 7 | 0.50593 |
| Decile 6 | 0.494119 |
| Median | 0.482789 |
| Decile 4 | 0.470526 |
| Decile 3 | 0.4582 |
| Decile 2 | 0.442865 |
| Decile 1 | 0.420819 |
| Minimum | 0 |
|
|
- Mean = 0.479682
- Std.dev = 0.0474831
- 7 items below graph minimum of 0.30497
|
Notes
Weighted-mean MO (diffusion tensor mode) in tract left posterior thalamic radiation (from dMRI data)
0 Related Data-Fields
There are no related data-fields
2 Applications
| Application ID | Title |
|---|
| 17689 | Genetic, environmental and lifestyle predictors of brain/cognitive-related outcomes. |
| 22783 | The joint analysis of imaging data and genetic data for early tumor detection, prevention, diagnosis and treatment |

