Data
83,909 items of data are available, covering 79,382 participants.
Defined-instances run from 2 to 3, labelled using Instancing
2.
Units of measurement are AU.
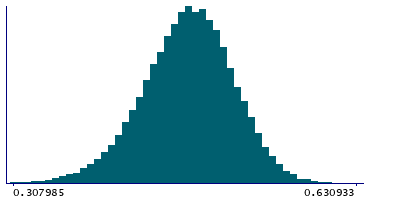
| Maximum | 0.630933 |
| Decile 9 | 0.523277 |
| Decile 8 | 0.505826 |
| Decile 7 | 0.493297 |
| Decile 6 | 0.482282 |
| Median | 0.47158 |
| Decile 4 | 0.460965 |
| Decile 3 | 0.449091 |
| Decile 2 | 0.434509 |
| Decile 1 | 0.413234 |
| Minimum | -0.00755253 |
|
|
- Mean = 0.469389
- Std.dev = 0.044223
- 123 items below graph minimum of 0.303191
|
2 Instances
Instance 2 : Imaging visit (2014+)
79,151 participants, 79,151 items
| Maximum | 0.630933 |
| Decile 9 | 0.523277 |
| Decile 8 | 0.505769 |
| Decile 7 | 0.493185 |
| Decile 6 | 0.482158 |
| Median | 0.471476 |
| Decile 4 | 0.460877 |
| Decile 3 | 0.448996 |
| Decile 2 | 0.434405 |
| Decile 1 | 0.413151 |
| Minimum | -0.00755253 |
|

|
- Mean = 0.469292
- Std.dev = 0.0442982
- 120 items below graph minimum of 0.303024
|
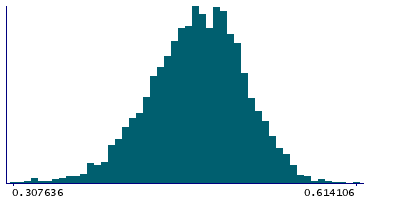
Instance 3 : First repeat imaging visit (2019+)
4,758 participants, 4,758 items
| Maximum | 0.614106 |
| Decile 9 | 0.523345 |
| Decile 8 | 0.506923 |
| Decile 7 | 0.495182 |
| Decile 6 | 0.484529 |
| Median | 0.473371 |
| Decile 4 | 0.462718 |
| Decile 3 | 0.450712 |
| Decile 2 | 0.43639 |
| Decile 1 | 0.415407 |
| Minimum | 0 |
|
|
- Mean = 0.47101
- Std.dev = 0.0429201
- 4 items below graph minimum of 0.307469
|
Notes
Weighted-mean MO (diffusion tensor mode) in tract left uncinate fasciculus (from dMRI data)
0 Related Data-Fields
There are no related data-fields
2 Applications
| Application ID | Title |
|---|
| 17689 | Genetic, environmental and lifestyle predictors of brain/cognitive-related outcomes. |
| 22783 | The joint analysis of imaging data and genetic data for early tumor detection, prevention, diagnosis and treatment |

