Data
83,909 items of data are available, covering 79,382 participants.
Defined-instances run from 2 to 3, labelled using Instancing
2.
Units of measurement are AU.
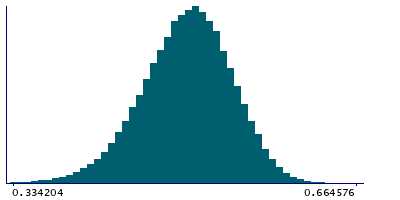
| Maximum | 0.666909 |
| Decile 9 | 0.553908 |
| Decile 8 | 0.536664 |
| Decile 7 | 0.523962 |
| Decile 6 | 0.512691 |
| Median | 0.502134 |
| Decile 4 | 0.491108 |
| Decile 3 | 0.478868 |
| Decile 2 | 0.464257 |
| Decile 1 | 0.44286 |
| Minimum | 0 |
|
|
- Mean = 0.499607
- Std.dev = 0.0446066
- 119 items below graph minimum of 0.331812
- 1 item above graph maximum of 0.664956
|
2 Instances
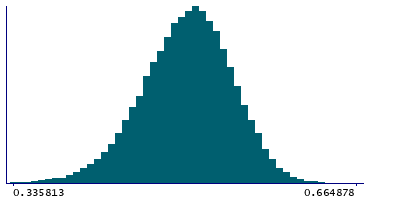
Instance 2 : Imaging visit (2014+)
79,151 participants, 79,151 items
| Maximum | 0.666909 |
| Decile 9 | 0.553947 |
| Decile 8 | 0.536701 |
| Decile 7 | 0.524061 |
| Decile 6 | 0.512752 |
| Median | 0.502157 |
| Decile 4 | 0.491129 |
| Decile 3 | 0.47888 |
| Decile 2 | 0.464276 |
| Decile 1 | 0.442812 |
| Minimum | 0 |
|
|
- Mean = 0.499617
- Std.dev = 0.0446625
- 114 items below graph minimum of 0.331678
- 1 item above graph maximum of 0.665082
|
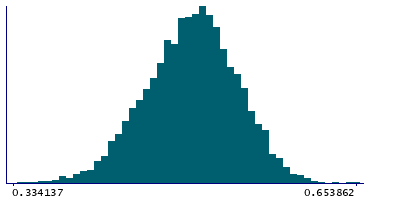
Instance 3 : First repeat imaging visit (2019+)
4,758 participants, 4,758 items
| Maximum | 0.653862 |
| Decile 9 | 0.552908 |
| Decile 8 | 0.53585 |
| Decile 7 | 0.522503 |
| Decile 6 | 0.511977 |
| Median | 0.50163 |
| Decile 4 | 0.491016 |
| Decile 3 | 0.478522 |
| Decile 2 | 0.463818 |
| Decile 1 | 0.443525 |
| Minimum | 0.00140395 |
|
|
- Mean = 0.499437
- Std.dev = 0.043666
- 5 items below graph minimum of 0.334141
|
Notes
Weighted-mean MO (diffusion tensor mode) in tract right uncinate fasciculus (from dMRI data)
0 Related Data-Fields
There are no related data-fields
2 Applications
| Application ID | Title |
|---|
| 17689 | Genetic, environmental and lifestyle predictors of brain/cognitive-related outcomes. |
| 22783 | The joint analysis of imaging data and genetic data for early tumor detection, prevention, diagnosis and treatment |

