Data
83,909 items of data are available, covering 79,382 participants.
Defined-instances run from 2 to 3, labelled using Instancing
2.
Units of measurement are AU.
| Maximum | 0.00312333 |
| Decile 9 | 0.00125426 |
| Decile 8 | 0.00121832 |
| Decile 7 | 0.00119696 |
| Decile 6 | 0.00118115 |
| Median | 0.00116713 |
| Decile 4 | 0.00115383 |
| Decile 3 | 0.00114029 |
| Decile 2 | 0.00112499 |
| Decile 1 | 0.00110455 |
| Minimum | 0 |
|

|
- Mean = 0.001176
- Std.dev = 7.16574e-05
- 21 items below graph minimum of 0.000954838
- 928 items above graph maximum of 0.00140397
|
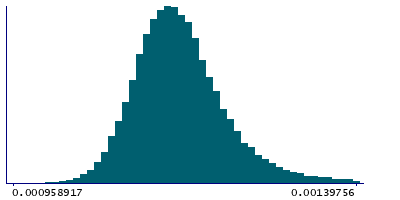
2 Instances
Instance 2 : Imaging visit (2014+)
79,151 participants, 79,151 items
| Maximum | 0.00312333 |
| Decile 9 | 0.00125561 |
| Decile 8 | 0.00121928 |
| Decile 7 | 0.00119788 |
| Decile 6 | 0.00118197 |
| Median | 0.00116793 |
| Decile 4 | 0.00115453 |
| Decile 3 | 0.00114091 |
| Decile 2 | 0.00112563 |
| Decile 1 | 0.00110505 |
| Minimum | 0 |
|
|
- Mean = 0.00117683
- Std.dev = 7.19227e-05
- 19 items below graph minimum of 0.000954493
- 878 items above graph maximum of 0.00140616
|
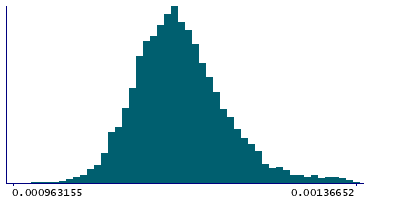
Instance 3 : First repeat imaging visit (2019+)
4,758 participants, 4,758 items
| Maximum | 0.00174346 |
| Decile 9 | 0.00123208 |
| Decile 8 | 0.00120152 |
| Decile 7 | 0.00118241 |
| Decile 6 | 0.00116774 |
| Median | 0.00115519 |
| Decile 4 | 0.00114352 |
| Decile 3 | 0.00113052 |
| Decile 2 | 0.00111634 |
| Decile 1 | 0.00109759 |
| Minimum | 0 |
|
|
- Mean = 0.00116219
- Std.dev = 6.55657e-05
- 2 items below graph minimum of 0.000963094
- 52 items above graph maximum of 0.00136658
|
Notes
Weighted-mean L1 in tract left parahippocampal part of cingulum (from dMRI data)
0 Related Data-Fields
There are no related data-fields
2 Applications
| Application ID | Title |
|---|
| 17689 | Genetic, environmental and lifestyle predictors of brain/cognitive-related outcomes. |
| 22783 | The joint analysis of imaging data and genetic data for early tumor detection, prevention, diagnosis and treatment |

