Data
83,909 items of data are available, covering 79,382 participants.
Defined-instances run from 2 to 3, labelled using Instancing
2.
Units of measurement are AU.
| Maximum | 0.00166524 |
| Decile 9 | 0.00130816 |
| Decile 8 | 0.00128983 |
| Decile 7 | 0.00127733 |
| Decile 6 | 0.00126717 |
| Median | 0.00125766 |
| Decile 4 | 0.00124856 |
| Decile 3 | 0.00123903 |
| Decile 2 | 0.00122781 |
| Decile 1 | 0.00121289 |
| Minimum | 0 |
|
|
- Mean = 0.0012594
- Std.dev = 4.18316e-05
- 29 items below graph minimum of 0.00111761
- 170 items above graph maximum of 0.00140343
|
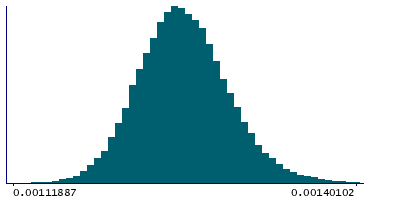
2 Instances
Instance 2 : Imaging visit (2014+)
79,151 participants, 79,151 items
| Maximum | 0.00166524 |
| Decile 9 | 0.00130872 |
| Decile 8 | 0.00129049 |
| Decile 7 | 0.00127789 |
| Decile 6 | 0.00126773 |
| Median | 0.00125827 |
| Decile 4 | 0.00124909 |
| Decile 3 | 0.00123953 |
| Decile 2 | 0.00122826 |
| Decile 1 | 0.00121326 |
| Minimum | 0 |
|

|
- Mean = 0.00125992
- Std.dev = 4.21038e-05
- 29 items below graph minimum of 0.00111779
- 161 items above graph maximum of 0.00140418
|
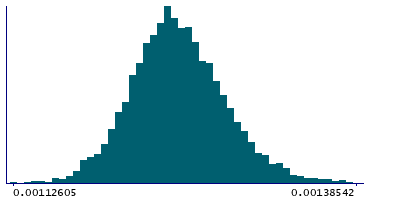
Instance 3 : First repeat imaging visit (2019+)
4,758 participants, 4,758 items
| Maximum | 0.00153034 |
| Decile 9 | 0.00129654 |
| Decile 8 | 0.00127901 |
| Decile 7 | 0.00126735 |
| Decile 6 | 0.00125752 |
| Median | 0.00124863 |
| Decile 4 | 0.00124061 |
| Decile 3 | 0.00123189 |
| Decile 2 | 0.00122158 |
| Decile 1 | 0.00120762 |
| Minimum | 0.00112605 |
|
|
- Mean = 0.00125078
- Std.dev = 3.59297e-05
- 5 items above graph maximum of 0.00138546
|
Notes
Weighted-mean L1 in tract left inferior longitudinal fasciculus (from dMRI data)
0 Related Data-Fields
There are no related data-fields
2 Applications
| Application ID | Title |
|---|
| 17689 | Genetic, environmental and lifestyle predictors of brain/cognitive-related outcomes. |
| 22783 | The joint analysis of imaging data and genetic data for early tumor detection, prevention, diagnosis and treatment |

