Data
83,909 items of data are available, covering 79,382 participants.
Defined-instances run from 2 to 3, labelled using Instancing
2.
Units of measurement are AU.
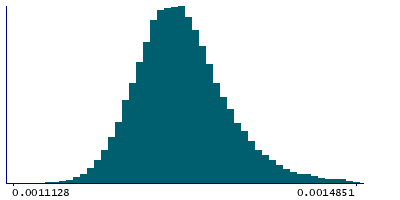
| Maximum | 0.00195564 |
| Decile 9 | 0.00136416 |
| Decile 8 | 0.00133662 |
| Decile 7 | 0.00131906 |
| Decile 6 | 0.00130556 |
| Median | 0.00129354 |
| Decile 4 | 0.00128185 |
| Decile 3 | 0.00126993 |
| Decile 2 | 0.00125649 |
| Decile 1 | 0.0012383 |
| Minimum | 0 |
|

|
- Mean = 0.00129828
- Std.dev = 5.69293e-05
- 27 items below graph minimum of 0.00111243
- 380 items above graph maximum of 0.00149003
|
2 Instances
Instance 2 : Imaging visit (2014+)
79,151 participants, 79,151 items
| Maximum | 0.00195564 |
| Decile 9 | 0.00136525 |
| Decile 8 | 0.00133788 |
| Decile 7 | 0.00132021 |
| Decile 6 | 0.00130656 |
| Median | 0.00129472 |
| Decile 4 | 0.00128311 |
| Decile 3 | 0.00127109 |
| Decile 2 | 0.00125768 |
| Decile 1 | 0.00123936 |
| Minimum | 0 |
|
|
- Mean = 0.00129947
- Std.dev = 5.66736e-05
- 24 items below graph minimum of 0.00111347
- 362 items above graph maximum of 0.00149114
|
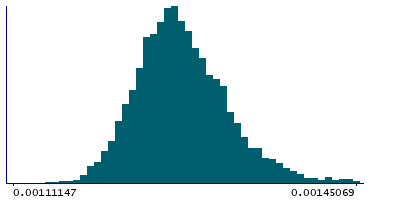
Instance 3 : First repeat imaging visit (2019+)
4,758 participants, 4,758 items
| Maximum | 0.00175692 |
| Decile 9 | 0.00133767 |
| Decile 8 | 0.00131474 |
| Decile 7 | 0.00129787 |
| Decile 6 | 0.00128492 |
| Median | 0.00127373 |
| Decile 4 | 0.00126383 |
| Decile 3 | 0.00125313 |
| Decile 2 | 0.00124135 |
| Decile 1 | 0.00122453 |
| Minimum | 0 |
|
|
- Mean = 0.0012785
- Std.dev = 5.75278e-05
- 3 items below graph minimum of 0.00111139
- 21 items above graph maximum of 0.00145082
|
Notes
Weighted-mean L1 in tract right posterior thalamic radiation (from dMRI data)
0 Related Data-Fields
There are no related data-fields
2 Applications
| Application ID | Title |
|---|
| 17689 | Genetic, environmental and lifestyle predictors of brain/cognitive-related outcomes. |
| 22783 | The joint analysis of imaging data and genetic data for early tumor detection, prevention, diagnosis and treatment |

