Data
83,905 items of data are available, covering 79,378 participants.
Defined-instances run from 2 to 3, labelled using Instancing
2.
Units of measurement are AU.
| Maximum | 0.989097 |
| Decile 9 | 0.582267 |
| Decile 8 | 0.570059 |
| Decile 7 | 0.561299 |
| Decile 6 | 0.553626 |
| Median | 0.546718 |
| Decile 4 | 0.539626 |
| Decile 3 | 0.532147 |
| Decile 2 | 0.523196 |
| Decile 1 | 0.510426 |
| Minimum | 0 |
|
|
- Mean = 0.546371
- Std.dev = 0.0305476
- 68 items below graph minimum of 0.438585
- 33 items above graph maximum of 0.654108
|
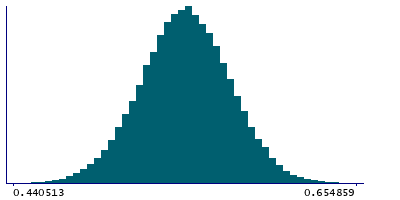
2 Instances
Instance 2 : Imaging visit (2014+)
79,147 participants, 79,147 items
| Maximum | 0.989097 |
| Decile 9 | 0.582028 |
| Decile 8 | 0.569821 |
| Decile 7 | 0.561025 |
| Decile 6 | 0.553376 |
| Median | 0.546431 |
| Decile 4 | 0.539342 |
| Decile 3 | 0.53185 |
| Decile 2 | 0.522875 |
| Decile 1 | 0.510094 |
| Minimum | 0 |
|

|
- Mean = 0.546095
- Std.dev = 0.0305207
- 64 items below graph minimum of 0.438159
- 33 items above graph maximum of 0.653962
|
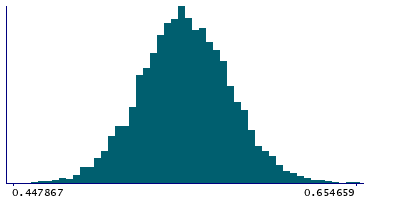
Instance 3 : First repeat imaging visit (2019+)
4,758 participants, 4,758 items
| Maximum | 0.657868 |
| Decile 9 | 0.585742 |
| Decile 8 | 0.573934 |
| Decile 7 | 0.565326 |
| Decile 6 | 0.55789 |
| Median | 0.550993 |
| Decile 4 | 0.544291 |
| Decile 3 | 0.537154 |
| Decile 2 | 0.528707 |
| Decile 1 | 0.516771 |
| Minimum | 0 |
|
|
- Mean = 0.550962
- Std.dev = 0.0306301
- 5 items below graph minimum of 0.4478
- 1 item above graph maximum of 0.654714
|
Notes
Weighted-mean ICVF (intra-cellular volume fraction) in tract left acoustic radiation (from dMRI data)
0 Related Data-Fields
There are no related data-fields
2 Applications
| Application ID | Title |
|---|
| 17689 | Genetic, environmental and lifestyle predictors of brain/cognitive-related outcomes. |
| 22783 | The joint analysis of imaging data and genetic data for early tumor detection, prevention, diagnosis and treatment |

