Data
83,905 items of data are available, covering 79,378 participants.
Defined-instances run from 2 to 3, labelled using Instancing
2.
Units of measurement are AU.
| Maximum | 0.99 |
| Decile 9 | 0.777617 |
| Decile 8 | 0.764926 |
| Decile 7 | 0.755709 |
| Decile 6 | 0.748112 |
| Median | 0.741038 |
| Decile 4 | 0.734024 |
| Decile 3 | 0.726367 |
| Decile 2 | 0.717256 |
| Decile 1 | 0.704653 |
| Minimum | 0 |
|

|
- Mean = 0.740753
- Std.dev = 0.0342216
- 94 items below graph minimum of 0.63169
- 47 items above graph maximum of 0.85058
|
2 Instances
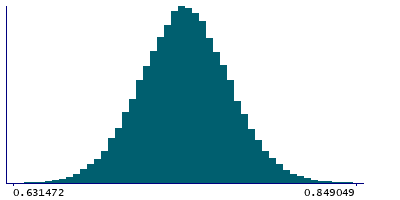
Instance 2 : Imaging visit (2014+)
79,147 participants, 79,147 items
| Maximum | 0.99 |
| Decile 9 | 0.777451 |
| Decile 8 | 0.76465 |
| Decile 7 | 0.755367 |
| Decile 6 | 0.747777 |
| Median | 0.740694 |
| Decile 4 | 0.733647 |
| Decile 3 | 0.725947 |
| Decile 2 | 0.71688 |
| Decile 1 | 0.704273 |
| Minimum | 0 |
|
|
- Mean = 0.740425
- Std.dev = 0.0342721
- 91 items below graph minimum of 0.631095
- 46 items above graph maximum of 0.850628
|
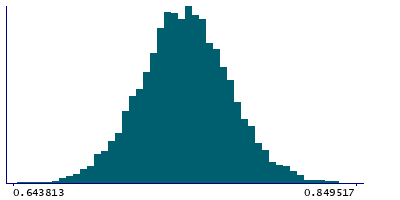
Instance 3 : First repeat imaging visit (2019+)
4,758 participants, 4,758 items
| Maximum | 0.857006 |
| Decile 9 | 0.78097 |
| Decile 8 | 0.768758 |
| Decile 7 | 0.760137 |
| Decile 6 | 0.753262 |
| Median | 0.74668 |
| Decile 4 | 0.739654 |
| Decile 3 | 0.733002 |
| Decile 2 | 0.724779 |
| Decile 1 | 0.712369 |
| Minimum | 0 |
|
|
- Mean = 0.746214
- Std.dev = 0.0328924
- 3 items below graph minimum of 0.643769
- 1 item above graph maximum of 0.84957
|
Notes
Weighted-mean ICVF (intra-cellular volume fraction) in tract middle cerebellar peduncle (from dMRI data)
0 Related Data-Fields
There are no related data-fields
2 Applications
| Application ID | Title |
|---|
| 17689 | Genetic, environmental and lifestyle predictors of brain/cognitive-related outcomes. |
| 22783 | The joint analysis of imaging data and genetic data for early tumor detection, prevention, diagnosis and treatment |

