Data
83,905 items of data are available, covering 79,378 participants.
Defined-instances run from 2 to 3, labelled using Instancing
2.
Units of measurement are AU.
| Maximum | 0.445227 |
| Decile 9 | 0.250428 |
| Decile 8 | 0.245304 |
| Decile 7 | 0.241677 |
| Decile 6 | 0.238654 |
| Median | 0.235847 |
| Decile 4 | 0.233038 |
| Decile 3 | 0.230033 |
| Decile 2 | 0.22649 |
| Decile 1 | 0.22168 |
| Minimum | 0 |
|
|
- Mean = 0.235908
- Std.dev = 0.0120087
- 41 items below graph minimum of 0.192931
- 52 items above graph maximum of 0.279177
|
2 Instances
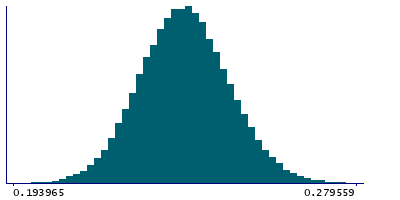
Instance 2 : Imaging visit (2014+)
79,147 participants, 79,147 items
| Maximum | 0.311429 |
| Decile 9 | 0.250333 |
| Decile 8 | 0.245213 |
| Decile 7 | 0.241585 |
| Decile 6 | 0.238554 |
| Median | 0.235751 |
| Decile 4 | 0.232941 |
| Decile 3 | 0.229924 |
| Decile 2 | 0.22639 |
| Decile 1 | 0.221574 |
| Minimum | 0 |
|

|
- Mean = 0.235812
- Std.dev = 0.0119764
- 39 items below graph minimum of 0.192815
- 50 items above graph maximum of 0.279092
|
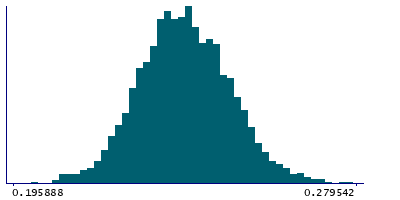
Instance 3 : First repeat imaging visit (2019+)
4,758 participants, 4,758 items
| Maximum | 0.445227 |
| Decile 9 | 0.251661 |
| Decile 8 | 0.246789 |
| Decile 7 | 0.243383 |
| Decile 6 | 0.240027 |
| Median | 0.237371 |
| Decile 4 | 0.234404 |
| Decile 3 | 0.231738 |
| Decile 2 | 0.228273 |
| Decile 1 | 0.223772 |
| Minimum | 0 |
|
|
- Mean = 0.237496
- Std.dev = 0.0124263
- 2 items below graph minimum of 0.195883
- 2 items above graph maximum of 0.279549
|
Notes
Weighted-mean OD (orientation dispersion index) in tract left anterior thalamic radiation (from dMRI data)
0 Related Data-Fields
There are no related data-fields
2 Applications
| Application ID | Title |
|---|
| 17689 | Genetic, environmental and lifestyle predictors of brain/cognitive-related outcomes. |
| 22783 | The joint analysis of imaging data and genetic data for early tumor detection, prevention, diagnosis and treatment |

