Data
83,905 items of data are available, covering 79,378 participants.
Defined-instances run from 2 to 3, labelled using Instancing
2.
Units of measurement are AU.
| Maximum | 0.340122 |
| Decile 9 | 0.181258 |
| Decile 8 | 0.17638 |
| Decile 7 | 0.173017 |
| Decile 6 | 0.170195 |
| Median | 0.167628 |
| Decile 4 | 0.165055 |
| Decile 3 | 0.162358 |
| Decile 2 | 0.15921 |
| Decile 1 | 0.154925 |
| Minimum | 0 |
|

|
- Mean = 0.16791
- Std.dev = 0.0108276
- 23 items below graph minimum of 0.128592
- 86 items above graph maximum of 0.207592
|
2 Instances
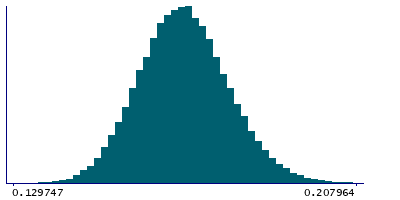
Instance 2 : Imaging visit (2014+)
79,147 participants, 79,147 items
| Maximum | 0.340122 |
| Decile 9 | 0.181085 |
| Decile 8 | 0.176217 |
| Decile 7 | 0.172866 |
| Decile 6 | 0.170046 |
| Median | 0.167489 |
| Decile 4 | 0.164892 |
| Decile 3 | 0.162196 |
| Decile 2 | 0.159069 |
| Decile 1 | 0.154779 |
| Minimum | 0 |
|
|
- Mean = 0.167762
- Std.dev = 0.0108195
- 21 items below graph minimum of 0.128473
- 87 items above graph maximum of 0.207391
|
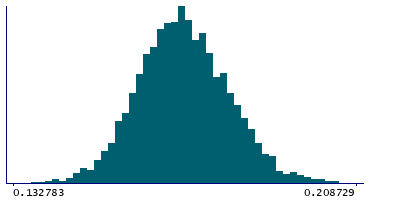
Instance 3 : First repeat imaging visit (2019+)
4,758 participants, 4,758 items
| Maximum | 0.270935 |
| Decile 9 | 0.183415 |
| Decile 8 | 0.178806 |
| Decile 7 | 0.175372 |
| Decile 6 | 0.172559 |
| Median | 0.170101 |
| Decile 4 | 0.167598 |
| Decile 3 | 0.16503 |
| Decile 2 | 0.162083 |
| Decile 1 | 0.158095 |
| Minimum | 0 |
|
|
- Mean = 0.170372
- Std.dev = 0.0106649
- 2 items below graph minimum of 0.132775
- 3 items above graph maximum of 0.208735
|
Notes
Weighted-mean OD (orientation dispersion index) in tract right inferior fronto-occipital fasciculus (from dMRI data)
0 Related Data-Fields
There are no related data-fields
2 Applications
| Application ID | Title |
|---|
| 17689 | Genetic, environmental and lifestyle predictors of brain/cognitive-related outcomes. |
| 22783 | The joint analysis of imaging data and genetic data for early tumor detection, prevention, diagnosis and treatment |

