Data
83,905 items of data are available, covering 79,378 participants.
Defined-instances run from 2 to 3, labelled using Instancing
2.
Units of measurement are AU.
| Maximum | 0.378309 |
| Decile 9 | 0.19802 |
| Decile 8 | 0.194052 |
| Decile 7 | 0.191285 |
| Decile 6 | 0.189026 |
| Median | 0.186944 |
| Decile 4 | 0.184929 |
| Decile 3 | 0.182794 |
| Decile 2 | 0.180328 |
| Decile 1 | 0.177002 |
| Minimum | 0 |
|
|
- Mean = 0.187354
- Std.dev = 0.00898637
- 15 items below graph minimum of 0.155983
- 179 items above graph maximum of 0.219039
|
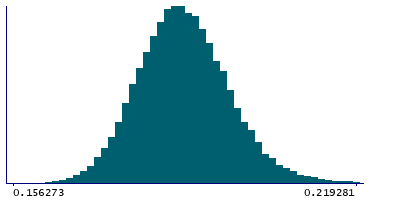
2 Instances
Instance 2 : Imaging visit (2014+)
79,147 participants, 79,147 items
| Maximum | 0.378309 |
| Decile 9 | 0.197901 |
| Decile 8 | 0.193916 |
| Decile 7 | 0.191147 |
| Decile 6 | 0.188886 |
| Median | 0.186821 |
| Decile 4 | 0.184796 |
| Decile 3 | 0.182685 |
| Decile 2 | 0.180206 |
| Decile 1 | 0.176883 |
| Minimum | 0 |
|

|
- Mean = 0.187234
- Std.dev = 0.00898618
- 14 items below graph minimum of 0.155865
- 169 items above graph maximum of 0.218919
|
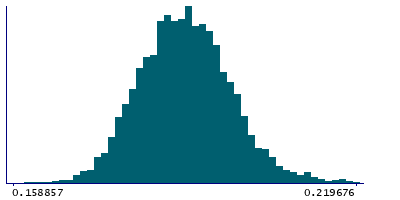
Instance 3 : First repeat imaging visit (2019+)
4,758 participants, 4,758 items
| Maximum | 0.255528 |
| Decile 9 | 0.199401 |
| Decile 8 | 0.195874 |
| Decile 7 | 0.19335 |
| Decile 6 | 0.191165 |
| Median | 0.189177 |
| Decile 4 | 0.187022 |
| Decile 3 | 0.184969 |
| Decile 2 | 0.18237 |
| Decile 1 | 0.179129 |
| Minimum | 0 |
|
|
- Mean = 0.189349
- Std.dev = 0.00875166
- 1 item below graph minimum of 0.158858
- 11 items above graph maximum of 0.219673
|
Notes
Weighted-mean OD (orientation dispersion index) in tract right inferior longitudinal fasciculus (from dMRI data)
0 Related Data-Fields
There are no related data-fields
2 Applications
| Application ID | Title |
|---|
| 17689 | Genetic, environmental and lifestyle predictors of brain/cognitive-related outcomes. |
| 22783 | The joint analysis of imaging data and genetic data for early tumor detection, prevention, diagnosis and treatment |

