Data
83,905 items of data are available, covering 79,378 participants.
Defined-instances run from 2 to 3, labelled using Instancing
2.
Units of measurement are AU.
| Maximum | 0.348864 |
| Decile 9 | 0.0977288 |
| Decile 8 | 0.090549 |
| Decile 7 | 0.0857984 |
| Decile 6 | 0.0820779 |
| Median | 0.0787921 |
| Decile 4 | 0.0756532 |
| Decile 3 | 0.0724769 |
| Decile 2 | 0.0688818 |
| Decile 1 | 0.0639629 |
| Minimum | 0 |
|

|
- Mean = 0.0800384
- Std.dev = 0.014008
- 246 items above graph maximum of 0.131495
|
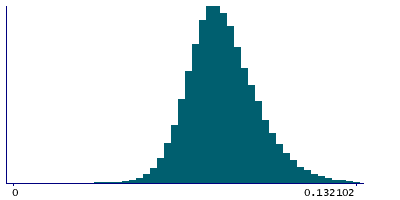
2 Instances
Instance 2 : Imaging visit (2014+)
79,147 participants, 79,147 items
| Maximum | 0.348864 |
| Decile 9 | 0.0977643 |
| Decile 8 | 0.0905546 |
| Decile 7 | 0.0857819 |
| Decile 6 | 0.0820492 |
| Median | 0.0787403 |
| Decile 4 | 0.0755625 |
| Decile 3 | 0.0723834 |
| Decile 2 | 0.0687507 |
| Decile 1 | 0.0638094 |
| Minimum | 0 |
|
|
- Mean = 0.0799793
- Std.dev = 0.0140819
- 230 items above graph maximum of 0.131719
|
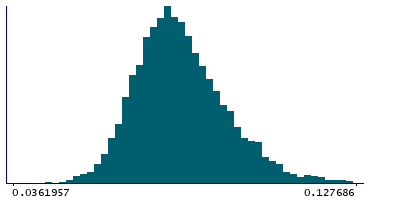
Instance 3 : First repeat imaging visit (2019+)
4,758 participants, 4,758 items
| Maximum | 0.194763 |
| Decile 9 | 0.0971902 |
| Decile 8 | 0.0905235 |
| Decile 7 | 0.0860241 |
| Decile 6 | 0.0825117 |
| Median | 0.0795932 |
| Decile 4 | 0.076856 |
| Decile 3 | 0.0739216 |
| Decile 2 | 0.0708862 |
| Decile 1 | 0.0666905 |
| Minimum | 0.0257056 |
|
|
- Mean = 0.0810209
- Std.dev = 0.0126745
- 1 item below graph minimum of 0.0361908
- 18 items above graph maximum of 0.12769
|
Notes
Weighted-mean ISOVF (isotropic or free water volume fraction) in tract left superior thalamic radiation (from dMRI data)
0 Related Data-Fields
There are no related data-fields
2 Applications
| Application ID | Title |
|---|
| 17689 | Genetic, environmental and lifestyle predictors of brain/cognitive-related outcomes. |
| 22783 | The joint analysis of imaging data and genetic data for early tumor detection, prevention, diagnosis and treatment |

